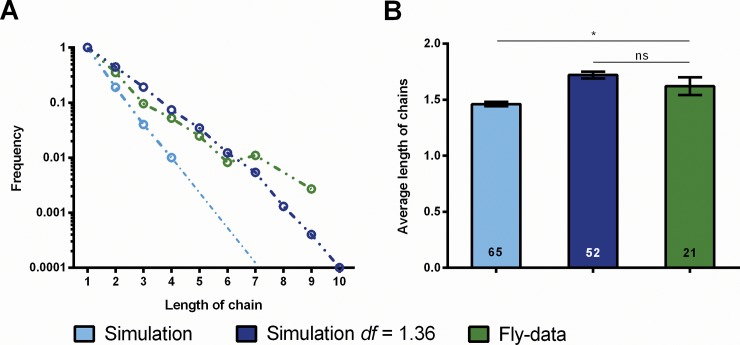
Fig 6. Chain lengths after removal of sidedness.
(A) Chain length frequencies. After removal of sidedness calculated chain lengths (light blue) still differ significantly from measured ones (green). This difference is attributed to dwelling (attention span at the FoA). When a dwelling factor of df = 1.36 is used to calculate chain length frequencies, simulation and fly-data give the best fit (dark blue). (B) Average chain lengths. Difference between calculation without dwelling (light blue) and fly data (green) is significant. Error bars are SEMs (*P < 0.05, **P < 0.01, ***P < 0.001).

