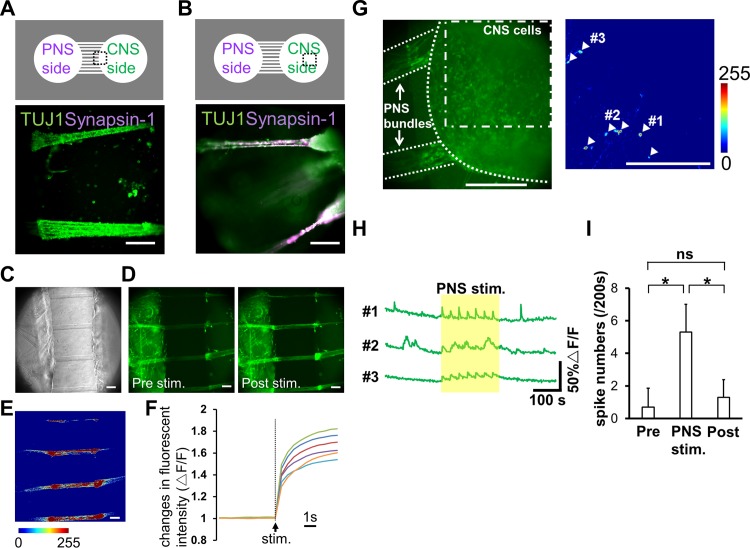
Fig 5. Structural and functional analysis of co-cultured neuronal networks.
(A, B) Immunofluorescence images of co-cultured neurons 48 days after cell plating (bottom panel). Different regions indicated in the diagram are shown (top panel). Synapsin-1 staining was detected in the chamber with central nervous system (CNS) neurons, but not in the microtunnels. (C, D) Phase-contrast images of cells and the fluorescence images of a calcium probe on day 39. Fluorescence images before (pre stim) and 1 s after applying the electrical stimulation (post stim) are shown. Fluorescence was increased after the stimulus (arrowheads). (E) Calcium response after the stimulation normalized to the signal before the stimulation. The color bar shows fluorescence intensity. Neurites in the microtunnels were induced with electrical stimulation. (F) Kinetics of calcium transient onset during applying the electrical stimulation. Data of 6 peripheral nervous system (PNS) bundles were considered. (G) Identification of CNS neurons that responded to PNS bundle stimulation. Left, a co-culture sample at day 29 labelled with fluo-4. Right, normalized calcium response in CNS neurons following PNS bundle stimulation (dot-dashed line). The color bar indicates fluorescence intensity. White arrowheads identify CNS neurons that exhibited a calcium response to PNS bundle stimulation. (H) Kinetic plots of calcium transients in CNS neurons represented in panel G. The region highlighted by the yellow rectangle indicates the period of electrical stimulation of PNS bundles. (I) The effect of PNS bundle stimulation on the activity of CNS neurons. Calcium spiking in CNS neurons was averaged pre-, during and post-PNS bundle stimulation. Values are reported as mean±S.D. (n = 20 neurons from 3 samples). Statistical analyses using an unpaired t-test are shown here (ns not significant, * p < 0.001; Scale bar: 100 μm).

