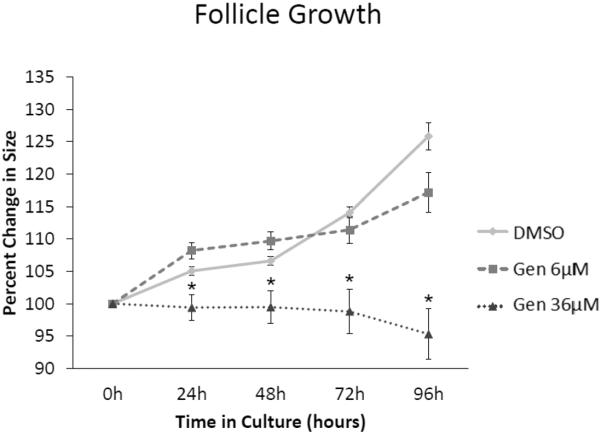
Figure 1. Effect of genistein on follicle growth over time.
After isolation, antral follicle growth was measured daily along perpendicular axes and percent change in growth was determined from 24 to 96 h. The graph represents the means ± SEM of percent change in follicle growth from 3 separate experiments. Asterisks (*) indicate a significant difference between control groups and genistein at each time point (n=3; p≤ 0.05).

