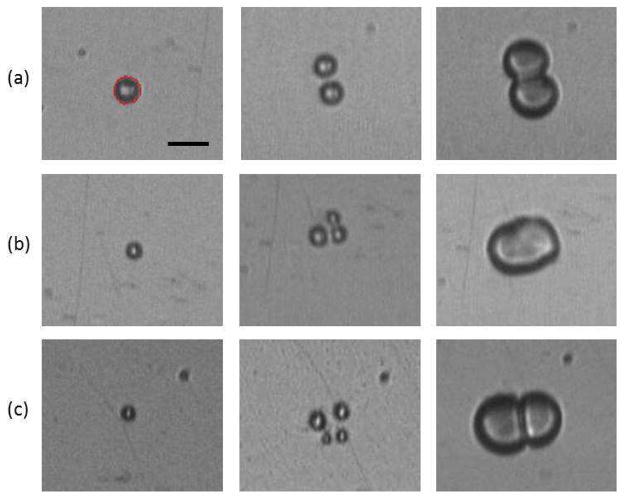
Figure 2.
Selected frames from three ultra-high speed recordings at approximately 10.5 Mfps of microbubble fragmentation into (a) 2, (b) 3 and (d) 4 bubbles and subsequent coalescence. The first column depicts a frame before ultrasound exposure, in which the initial microbubble diameter was extracted (3.6 μm, 2.6 μm and 2.4 μm). The microbubble in panel (a) was recorded under a 0.5 MPa exposure, while those in panels (b) and (c) experienced 1 MPa. All the microbubbles are situated in 1 cP fluid. Scale bar is 5 μm, and each panel is 21.90 × 18.45 μm. Microbubble size information was extracted by an edge detection algorithm (minimum cost algorithm based on pixel intensity gradients generated in-house in MATLAB), an example of which is shown in red on the first frame of panel (a).

