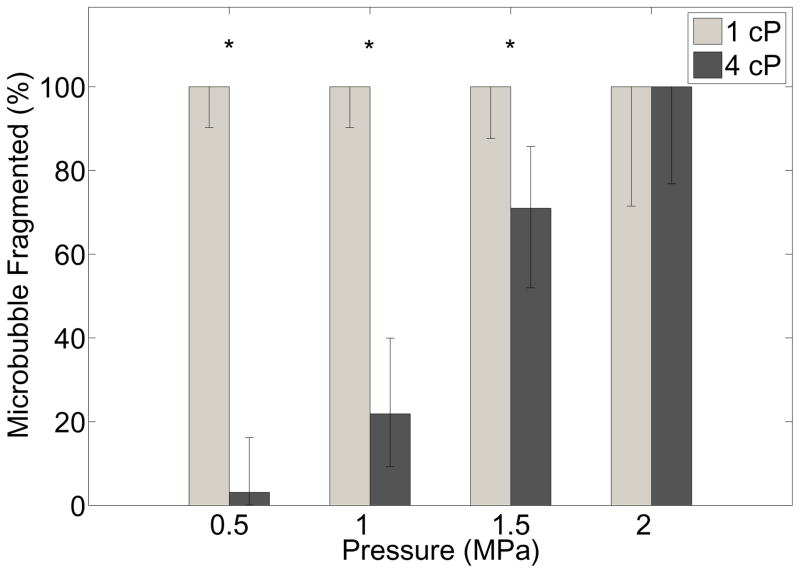
Figure 4.
Summary of the effects of liquid viscosity on microbubble behavior at high transmit pressures, displaying the percentage of microbubbles that undergo fragmentation as a function of pressure for microbubbles residing in (gray bars) 1 cP or (black bars) 4cP liquid. See text for microbubble size range details. Error bars denote the 95% confidence intervals (Clopper-Pearson interval), and stars denote statistical significance (p<0.002) as determined by Fisher’s exact test.

