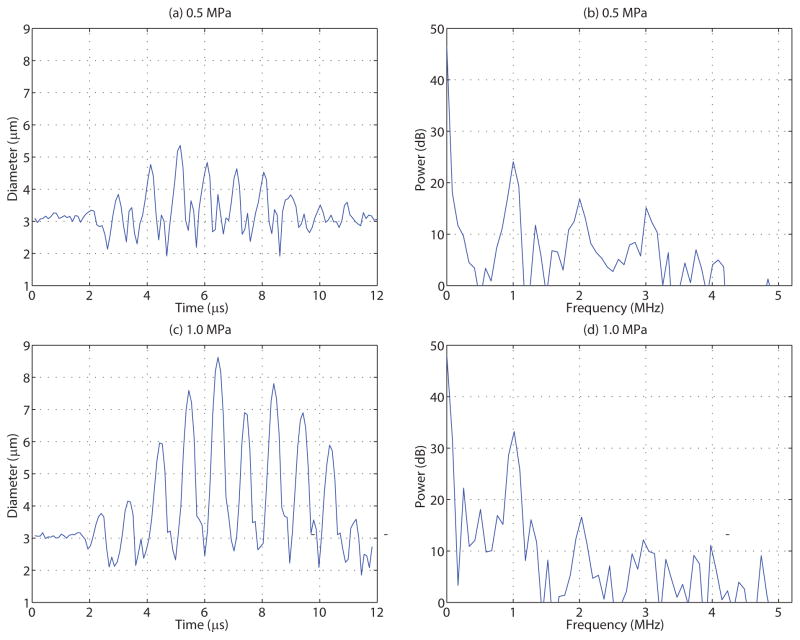
Figure 5.
The diameter versus time trace and corresponding Fourier transform of similarly sized individual microbubbles situated in a 4 cP fluid and insonicated at either (top) 0.5 MPa or (bottom) 1 MPa peak negative pressure. Microbubbles situated in 1 cP fluid did not remain intact at these pressures – see Figure 4.

