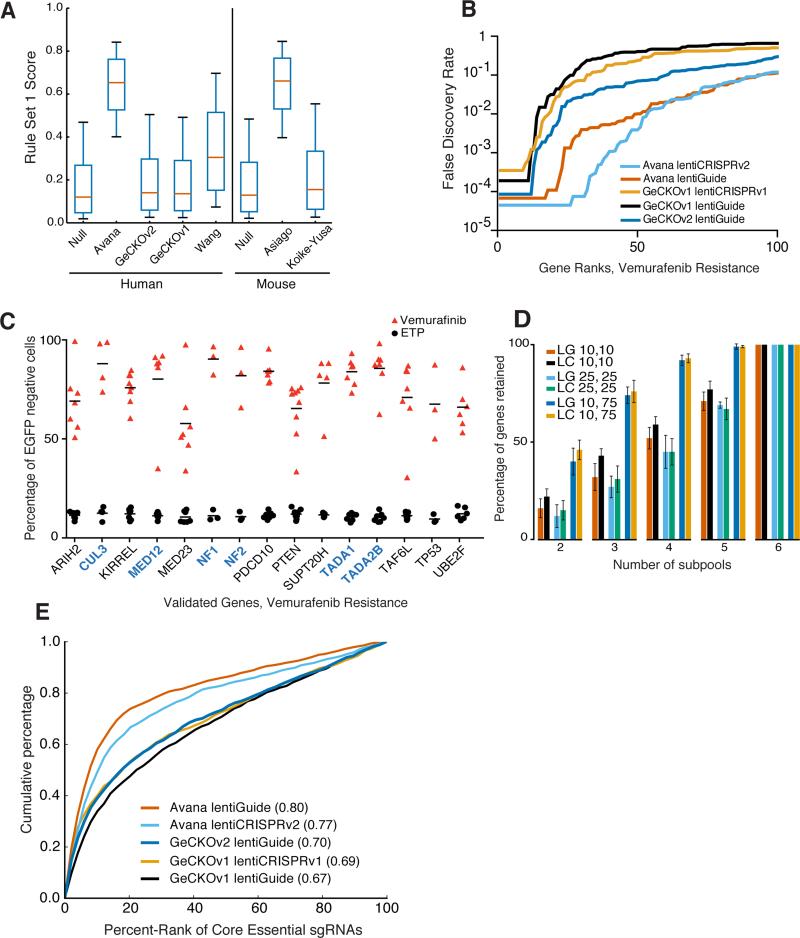
Figure 1.
Comparative performance of the Avana library. (a) Distribution of Rule Set 1 scores across libraries. The box represents the 25th, 50th, and 75th percentiles, whiskers show 5th and 95th percentiles. (b) Comparison of the FDR-corrected q-values determined by STARS for the top 100 ranked genes in the vemurafenib resistance assay in A375 cells. (c) Validation of individual sgRNAs for vemurafenib resistance in a competition assay in A375 cells. Horizontal bars represent the average of the individual sgRNAs for each gene. Previously-validated genes are labeled in blue. ETP = early time point. (d) Subsampling analysis of the Avana library. We first identified genes that passed at different FDR thresholds with STARS when all six subpools were analyzed (first number in legend), the average number of retained genes that score at different FDR thresholds following removal of subpools (second number in legend). LG = lentiGuide; LC = lentiCRISPRv2. (e) ROC-AUC analysis of individual sgRNAs targeting core essential genes in dropout screens in A375 cells. AUC values are indicated in parentheses.

