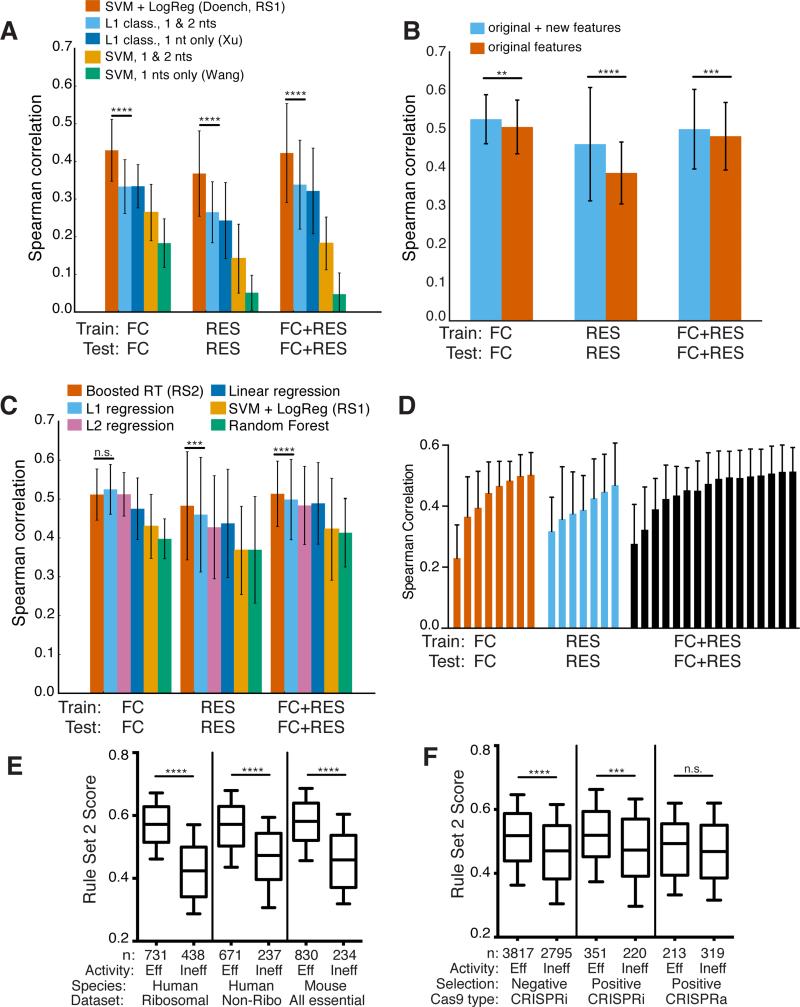
Figure 4.
Development of Rule Set 2 for prediction of sgRNA on-target activity. (a) Comparison of classification models. Spearman correlation between measured activity and predicted activity score is plotted. Error bars show the standard deviation across genes with a leave-one-gene-out approach. SVM + LogReg (Rule Set 1), performs better than the next-best model for all three datasets (left to right p-values of 1.8×10⁻⁸, 5.2×10⁻¹³, and p < 10−16, using the statistical test for differences in Spearman correlation)48. (b) Addition of new features improves performance using L1 linear regression. Significance determined as in (a), with p-values of, left to right, 4.2×10⁻³, p < 10−16, 2.32×10⁻⁴. (c) Comparison of regression models, as well as the best-performing classification model, SVM + LogReg. Significance values are shown for the comparison between gradient-boosted regression trees (Boosted RT) and L1 regression, using the same measure of significance as in (a), p-values of, left to right, 0.054, 4.9×10⁻⁴, and 5.3×10⁻⁵. (d) Assessment of modeling performance with increasing number of genes used in each training set. Error bars indicate one standard deviation across genes with a leave-one-gene-out approach. (e) Rule Set 2 performance on independently-generated negative selection datasets. From left to right, p-values for the three comparisons are 5.9×10−80, 2.1×10⁻²⁴, and 3.9×10⁻³⁵ (two-sample Kolmogorov-Smirnov test). (f) Rule Set 2 performance on independently-generated CRISPRa/i datasets. From left to right, p-values for the three comparisons are 1.8×10−40, 1.1×10⁻⁴, and 0.14 (two-sample Kolmogorov-Smirnov test).

