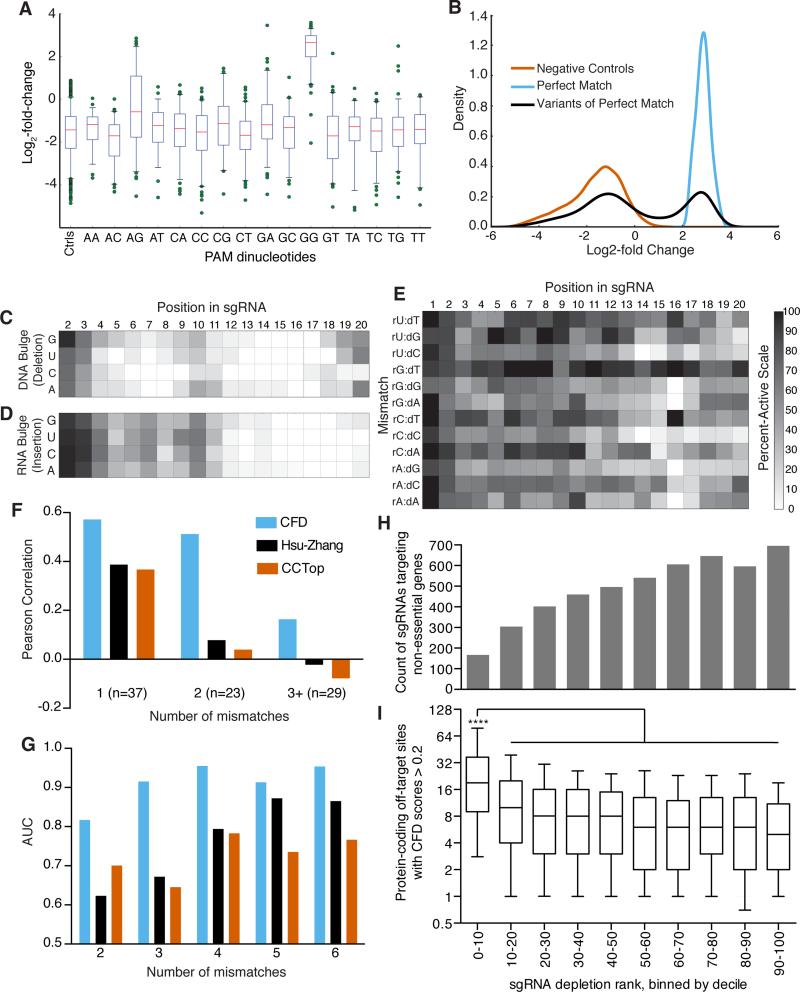
Figure 5.
CFD score for assessing off-target activity of sgRNAs. (a) Activity of sgRNAs as a function of the final two nucleotides of the PAM. The box represents the 25th, 50th, and 75th percentiles, whiskers show 5th and 95th percentiles, and outliers are shown as individual dots. (b) Distribution of log2-fold change values for three classifications of sgRNAs assessed by flow cytometry for activity against CD33. (c) Heat-map of the percent-active values for all sgRNA:DNA interactions where one nucleotide was removed from the sgRNA, creating a bulged DNA base. (d) Same as in (c) but with an insertion of nucleotide in the sgRNA to create a bulged RNA base. (e) Same as in (c) and (d) but with symmetric mismatches. Grayscale is the same for panels c – e. (f) Comparison of the correlation of 3 off-target scoring metrics to measured off-target activity of 89 sgRNAs with mismatches to the cell surface receptor H2-K (g) AUC values for GUIDE-Seq reads as a function of number of mismatches assessed by three scoring metrics; same color scheme as in (f). (h) Distribution of sgRNAs targeting non-essential genes in a dropout screen in A375 cells. All 109,463 sgRNAs in the Avana library screened in A375 cells were ranked by their depletion, binned by decile, and the count of 4,950 sgRNAs targeting the set of non-essential genes in each bin is plotted. (i) For the sgRNAs targeting non-essential genes plotted in (h), the distribution of the number of off-target sites in protein-coding regions with CFD scores > 0.2. The box represents the 25th, 50th, and 75th percentiles, whiskers show 10th and 90th percentiles. The first bin, with the most-depleted sgRNAs, is statistically significant compared to all other bins, Kruskal-Wallis test, p < 10−4. The x-axis is the same for panels (h) and (i).

