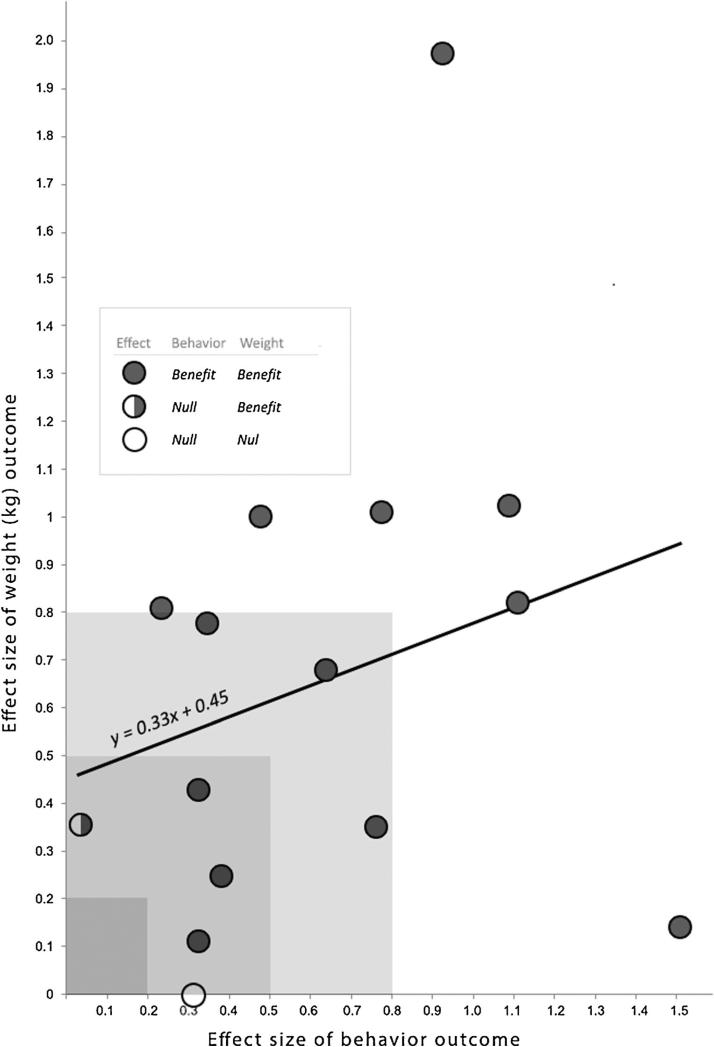
Fig. 4.
Scatterplot and best-fit line of the effect size of the change in the behavioral outcome (x-axis) against the effect size of change in the weight outcome (y-axis). Each circle represents one trial with dark-colored circles representing significant benefit. Dark shading represents effect sizes under 0.2, medium shading represents small effect sizes (Cohen's d between 0.2 and 0.5), lighter shading represents medium effect sizes (Cohen's d between 0.5 and 0.8), and no shading represents large effect sizes (Cohen's d greater than 0.8)

