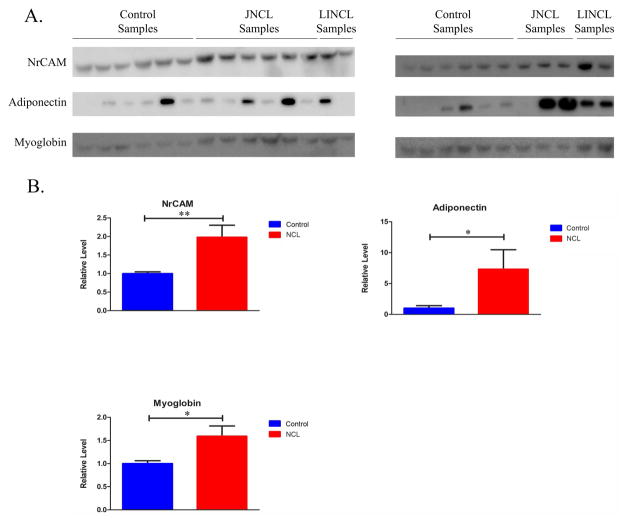
Figure 4.
Validation of analytes identified by Myriad-RBM. (a) Western blots were used to confirm and determine the expression profiles of identified analytes. (b) Densitometric analyses were used to quantify relative expression levels of MR identified analytes. Relative levels were normalized to total protein. Bars indicate mean ± SEM. Statistical significance for NrCAM and Adiponectin was determined using Mann Whitney Test (**, 0.0001 ≤ P ≤ 0.001; *, 0.002 ≤ P ≤ 0.05); Myoglobin was determined using Student’s T-test (*, 0.002 ≤ P ≤ 0.05).

