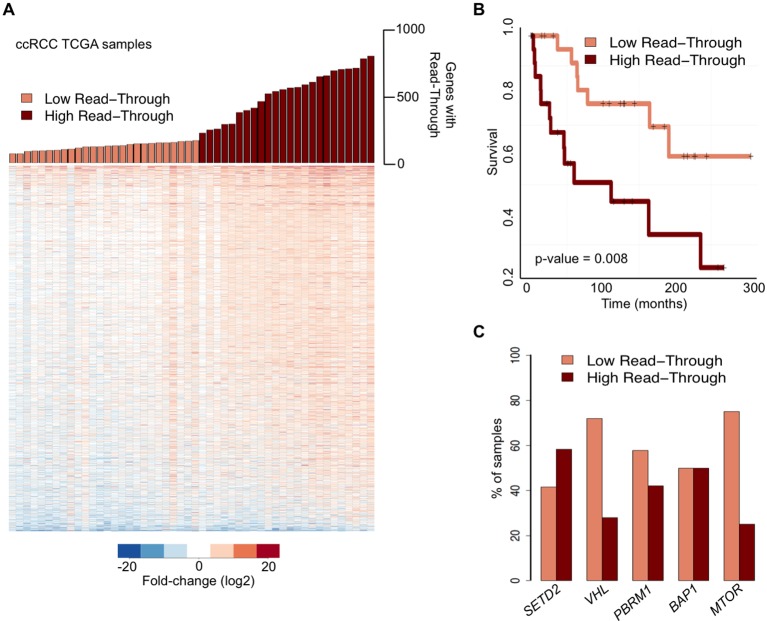
Figure 2. Transcription read-through correlates with ccRCC survival rates.
(A) The top graph indicates the number of genes with transcription read-through on each ccRCC patient sample. Samples were split in two groups according to the number of genes with transcription read-through (low or high), using 200 genes as a cut-off. The heatmap represents the RNA-seq tumor/matched normal fold change 4 Kb after the TTS region of genes with transcription read-through. (B) Kaplan-Meier plot comparing the survival of patients separated into ‘high read-through’ and ‘low read-through’ subsets as defined in A. (C) Proportion of ccRCC patient samples with low and high transcription read-through. Results are shown for samples containing any of the most recurrently mutated genes in ccRCC: SETD2, VHL, PBRM1, BAP1 and MTOR. Proportions of high and low read-through were significantly different between samples carrying mutation in SETD2 and in any of the remaining genes (Fisher’s Exact Test p<0.05).

