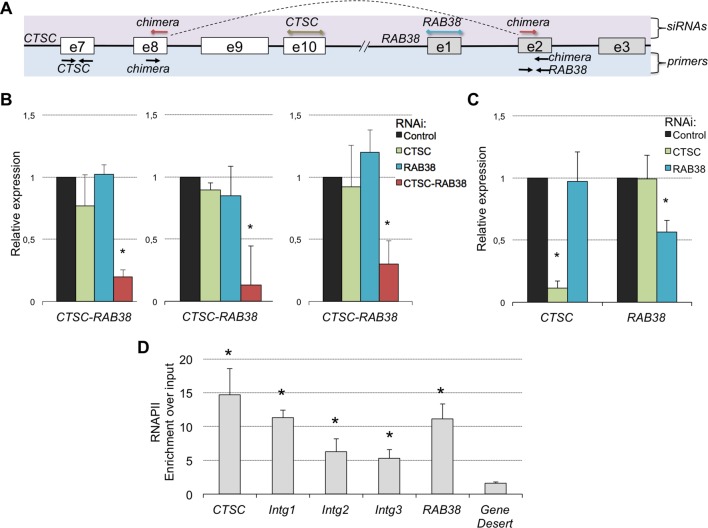
Figure 8. The CTSC-RAB38 chimera is recurrently detected in ccRCC.
(A) Schematic illustration of the CTSC-RAB38 locus depicting the position of the primers used to measure the transcripts levels by RT-qPCR shown in (B) and (C) and the position of the siRNAs targeting each of the three transcripts (CTSC, RAB38 and the CTSC-RAB38 chimera). The dashed curve in the scheme illustrates the splicing pattern of the chimeric transcript. (B) Relative expression of the CTSC-RAB38 chimeric transcript after depletion of the indicated transcripts by RNAi in three distinct ccRCC cell lines (FG2, MF, ER). (C) Relative expression of CTSC and RAB38 upon depletion of the indicated transcripts by RNAi in FG2 cells. Similar results were obtained with the other ccRCC cell lines. *p<0.05 by Student’s T-test compared to controls. (D) RNAPII ChIP along the CTSC-RAB38 locus in FG2 cells. Means and standard deviations from five independent experiments are shown. *p<0.05 by Student’s T-test compared to the gene desert.

