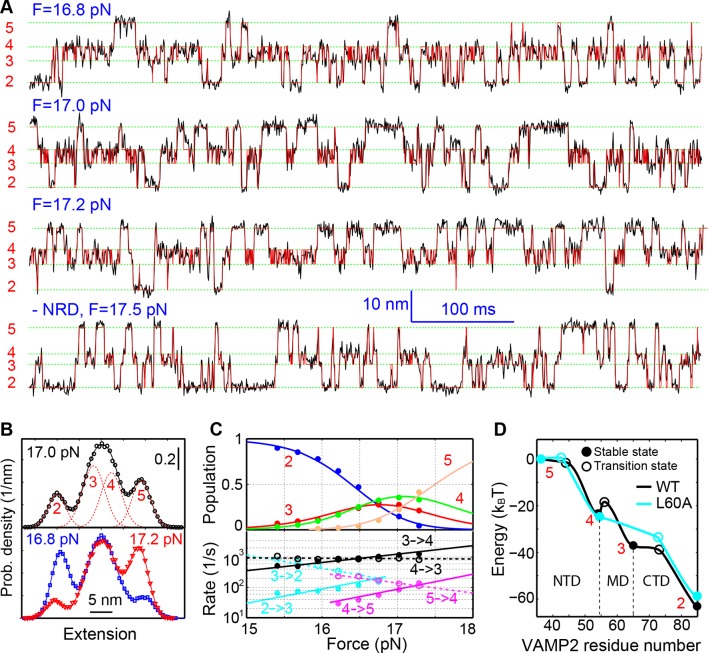
Figure 2. Energetics and kinetics of SNARE assembly.
(A) Extension-time trajectories of a single SNARE complex under the indicated constant mean forces. The idealized state transitions derived from hidden-Markov modeling (HMM) are shown as red lines. The positions of different states (red numbers) are marked by green dashed lines. Data were mean-filtered using a time window of 0.2 ms and shown. (B) Probability density distributions of the extensions corresponding to the first three traces in A and their best fits by a sum of four Gaussian functions (lines). (C) HMM-derived state populations (upper panel, symbols) and transition rates (lower panel, symbols) are shown as a function of the mean forces. The unfolding and folding rates are shown as solid and hollow symbols, respectively. Their best model fits are shown as lines (‘Materials and methods’). (D) Simplified folding energy landscapes of the wild-type (WT) and the mutant (L60A) SNARE complexes. The abscissa denotes the VAMP2 residue number bordering the structured and unstructured polypeptide regions in the corresponding folding state. All stable states (solid) and transition states (hollow) are defined in the presence of forces.
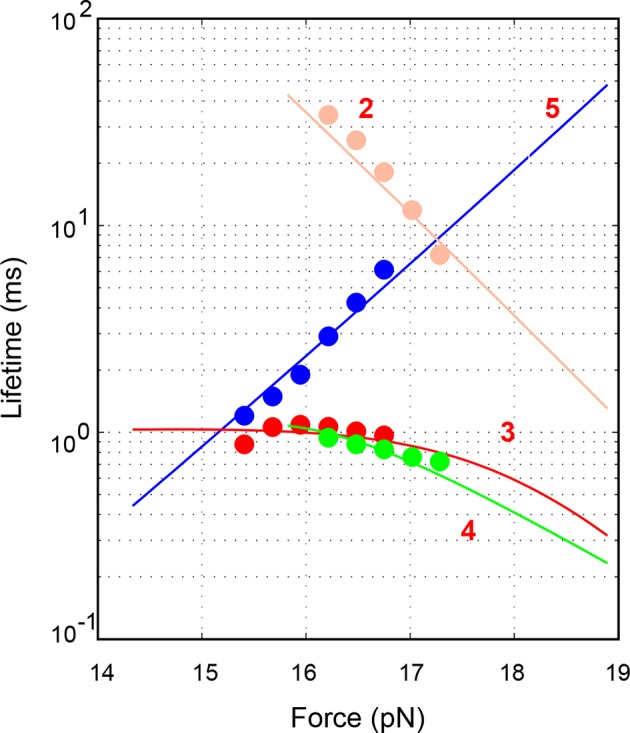
Figure 2—figure supplement 1. Force-dependent average lifetimes of the four states 2–5 involved in the SNARE assembly (symbols) and their best fits (lines).

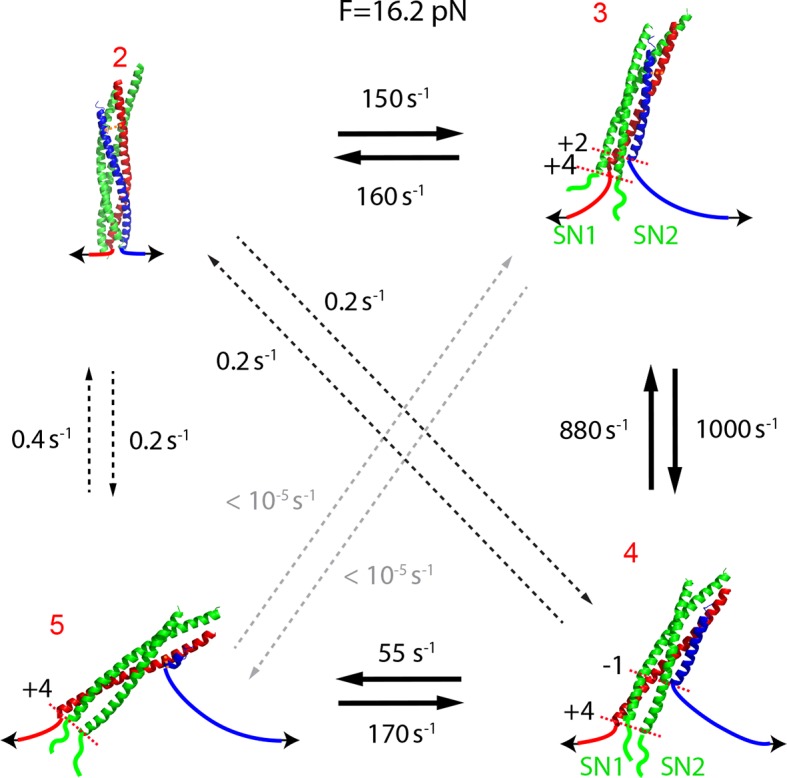
Figure 2—figure supplement 2. Transition rates determined by hidden-Markov modeling (HMM) shows that the t- and v-SNAREs sequentially assemble like a molecular zipper.

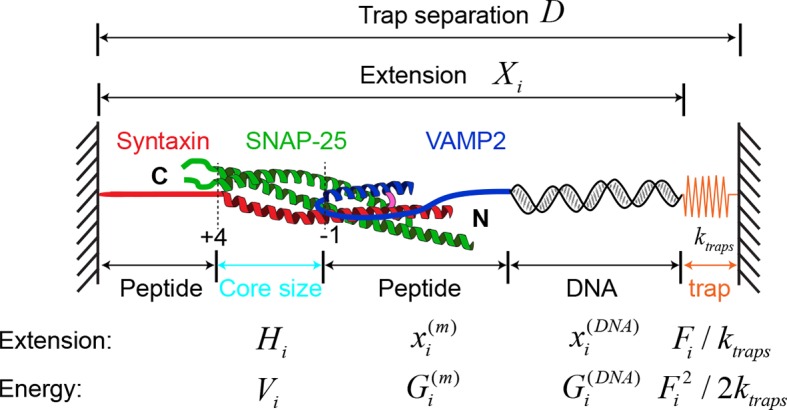
Figure 2—figure supplement 3. Modeling SNARE assembly observed in optical traps using the crystal structure of the SNARE complex and a simplified energy landscape.


