. 2015 Nov 27;4:e10616. doi: 10.7554/eLife.10616

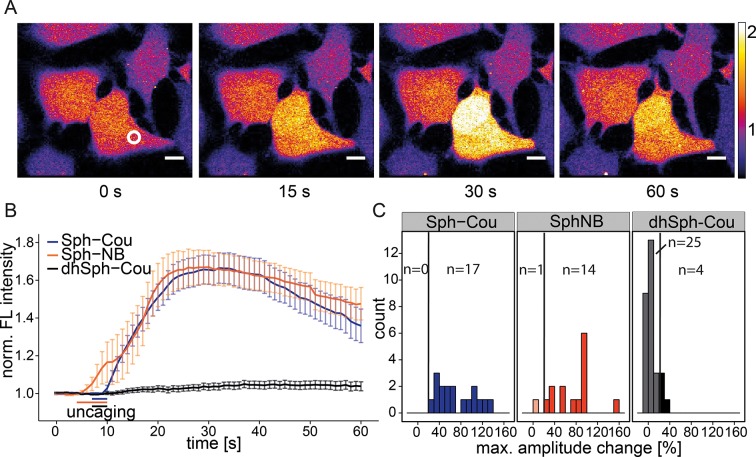
Figure 2. Local uncaging of Sph leads to calcium transients.

(A) Time-lapse confocal microscopy images of HeLa cells loaded with the calcium indicator Fluo-4 and treated with Sph-Cou. Cells were irradiated within the white circle at t = 7 s for 3 s. (B) Mean Fluo-4 fluorescence traces of cells loaded with compounds Sph-Cou (17 cells), Sph-NB (15 cells), and dhSph-Cou (29 cells), respectively. Uncaging was carried out for 3 s for coumarin-caged compounds and for 6 s for nitrobenzyl-caged sphingosine. The duration of uncaging for each lipid is represented by the color-coded bars. Traces represent mean values with the standard error of the mean plotted as error bars. (C) Histogram showing the distribution of the maximum observed amplitude compared to baseline of each analyzed cell. The vertical line represents the threshold set at 20% amplitude increase for responding cells.

DOI: http://dx.doi.org/10.7554/eLife.10616.007

Figure 2.

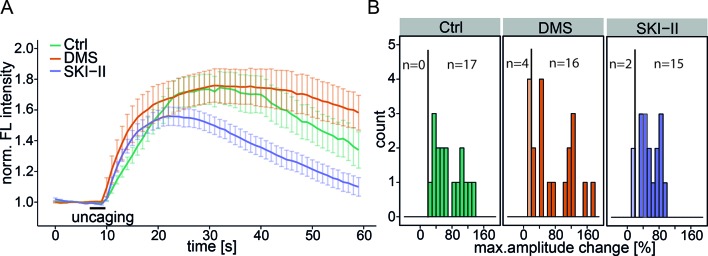
Figure 2—figure supplement 1. Inhibition of Sph kinases. .

Figure 2—figure supplement 1.

(A) HeLa cells were loaded with 2 µM Sph-Cou in basal conditions or incubated with Sph kinase inhibitor N,N-dimethylsphingosine (DMS, 1 µM, 20 cells or with SKI-II (10 µM, 17 cells). Uncaging was performed for 3 s as represented by the bar. Traces represent the mean values with the standard error of the mean plotted as error bars. (B) Histogram showing the distribution of the maximum observed amplitude compared to baseline with a threshold of 20% increase over baseline fluorescence.
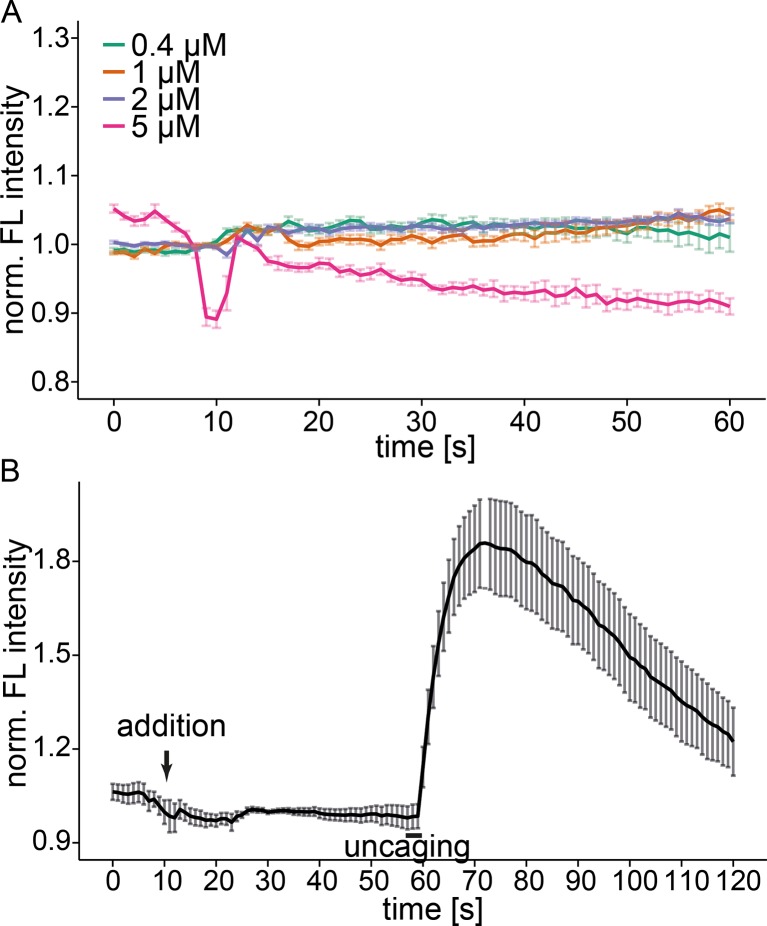
Figure 2—figure supplement 2. Free Sph does not induce calcium release.

Figure 2—figure supplement 2.

(A) HeLa cells were loaded with Fluo-4 and different concentrations of free Sph were added to the imaging medium at t=10s. Addition of 5 µM Sph leads to strong artifacts, cell blebbing and death of a fraction of the observed cells. (B) HeLa cells were loaded with Fluo-4 and Sph-Cou. Free Sph (4 µM) was added to the imaging medium at t=10s, and uncaging was carried out for 3s as represented by the black bar. Traces represent mean values with the standard error of the mean plotted as error bars.