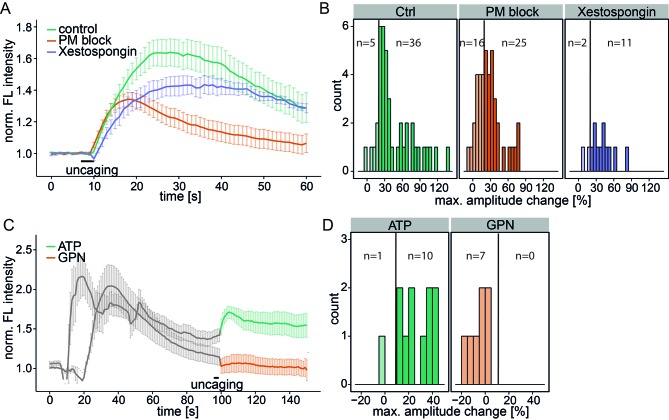
Figure 3. Investigating the source of Sph-induced calcium.
(A) HeLa cells were loaded with 2 µM Sph-Cou in wild-type conditions (41 cells) or in conditions inhibiting plasma membrane channels by removing extracellular calcium with ethylene glycol tetraacetic acid (EGTA) and by inhibition with 5 mM Ni2+ (PM block, 41 cells) or by blocking IP3 receptors at the ER using Xestospongin C at 25 µM (13 cells). Traces represent the mean values with the standard error of the mean plotted as error bars. (B) Histograms showing the distribution of the maximum observed amplitude change compared to baseline of all cells, with a threshold at 20%. (C) HeLa cells were loaded with 2 µM Sph-Cou. After addition of either 10 µM ATP to stimulate release of ER Ca2+ or addition of 200 µM glycyl-L-phenylalanine-beta-naphthylamide (GPN), which leads to release of Ca2+ from the acidic stores through osmotic rupture, uncaging was performed at t = 100 s after the primary calcium transient had passed, as indicated by the bar. (D) Histograms showing the distribution of the maximum observed amplitude of the calcium increase after uncaging. Since these observed effects are second calcium transients, we lowered the threshold for responding cells to 10% amplitude change over baseline.

