. 2015 Nov 27;4:e10616. doi: 10.7554/eLife.10616

Figure 4. Knock-out studies of two-pore channels.

(A) Primary mouse embryonic fibroblasts derived from a wild-type mouse (33 cells) or from two-pore channel 1 (TPC1) knock-out mice (25 cells), two-pore channel 2 (TPC2, 20 cells) knock-out mice or from a double knock-out mouse (DKO, 31 cells) were loaded with 2 µM Sph-Cou and uncaged for 3 s as indicated. Traces represent the mean values with standard errors of the mean plotted as error bars. (B) Histograms showing the distribution of the maximum observed amplitude compared to baseline, with the threshold set to 10% increase over baseline.

DOI: http://dx.doi.org/10.7554/eLife.10616.011

Figure 4.

Figure 4—figure supplement 1. Contribution of the lysosomal calcium channel TRPML1.

Figure 4—figure supplement 1.

(A) Human fibroblasts derived from healthy patients (control, 20 cells) or patients with mucolipidosis type IV (MLIV, 35 cells) were loaded with 2 µM Sph-Cou and uncaged for 3s as indicated. Traces represent the mean values with the standard error of the mean plotted as error bars. (B) Histograms showing the distribution of the maximum observed amplitude compared to baseline with the threshold set at 10% increase over baseline.
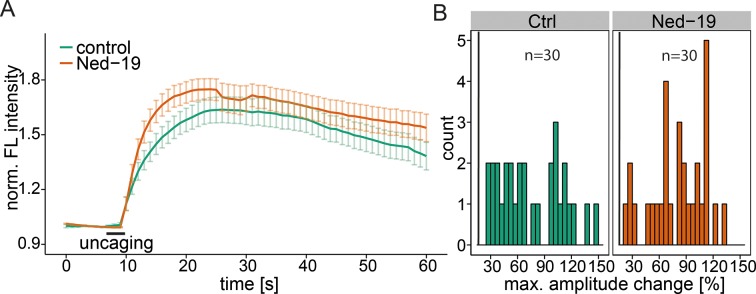
Figure 4—figure supplement 2. NAADP antagonist Ned-19.

Figure 4—figure supplement 2.

(A) HeLa cells were treated with 100 µM Ned-19 for 1 h before loading with Fluo-4 (30 min) and 2 µM Sph-Cou (15 min). Uncaging was performed for 3s as indicated. Traces represent the mean values with the standard error of the mean plotted as error bars. (B) Histograms showing the distribution of the maximum observed amplitude compared to baseline with the threshold set at 20% increase over baseline.