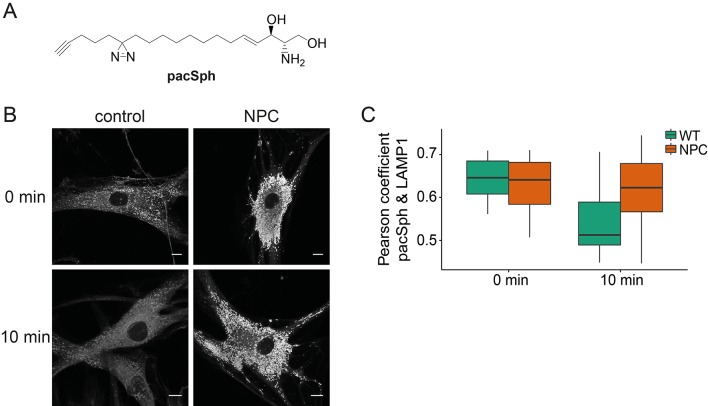
Figure 6. Subcellular localization of Sph.
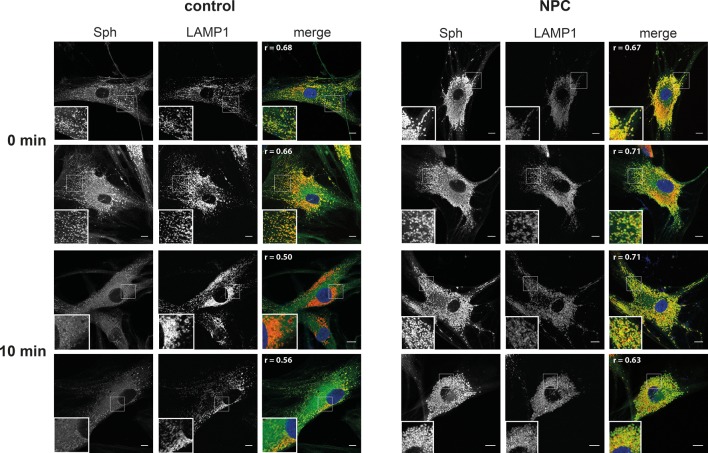
(A) Structure of pacSph. (B) Sph distribution in control and NPC human fibroblasts. Cells were incubated with 4 µM pacSph for 10 min, washed and either immediately photo-crosslinked and fixed (0 min) or incubated for further 10 min in buffer before crosslinking and fixation. Visualization was achieved by clicking Alexa488-azide to the terminal alkyne bond of pacSph. Confocal analysis shows a striking accumulation of Sph in the late endosomes/lysosomes of the NPC fibroblasts. For co-staining with the lysosomal marker LAMP1, see Figure 6—figure supplement 1. (C) Quantification of co-localization analysis by calculating Pearson’s correlation coefficient for >6 cells in each condition.


