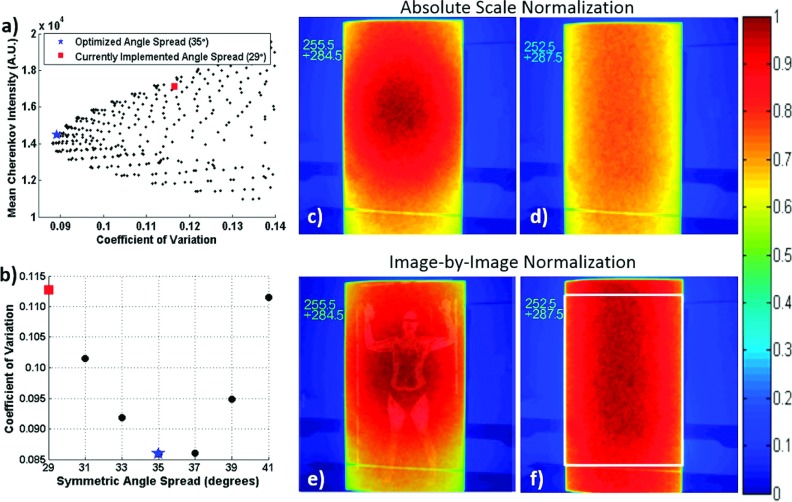
FIG. 2.
(a) Mean Cherenkov intensity (relative surface dose) vs coefficients of variation for a subset of angle pairs. The historical angle pair used at the institution (255.5° and 284.5°) is labeled by a red square, and the minimum coefficient of variation at a symmetrical angle pair occurred at 252.5° and 287.5°, denoted by the blue star. (b) Calculated coefficients of variation at symmetric angle spreads. The composite Cherenkov images for the original and optimal angles spreads are shown in (c) and (d), respectively, on the same normalization scale; the self-normalized Cherenkov images are shown in (e) and (f). The image in (e) is overlaid with an image of a TSET patient for size scale. The white box in (e) shows the analyzed ROI.

