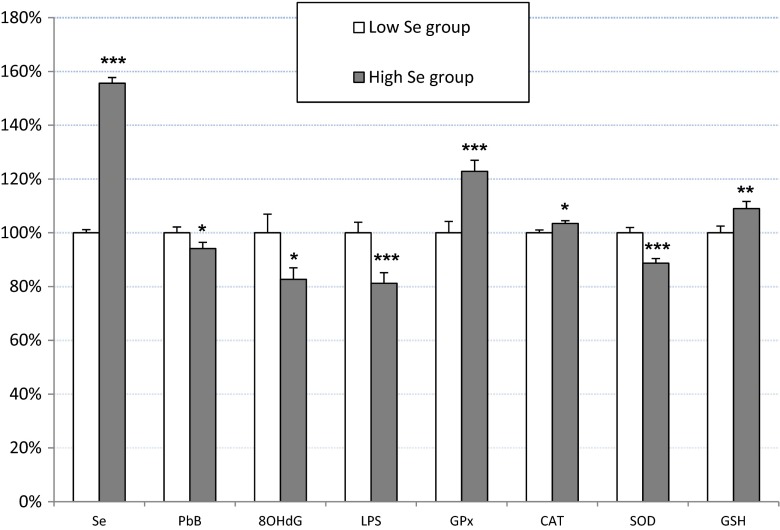
Fig. 1.
The concentration of selenium (Se) in serum, blood lead level (PbB), 8-hydroxydeoxyguanosine (8-OHdG) in urine, lipofuscin (LPS) in erythrocytes, the activity of glutathione peroxidase (GPx), catalase (CAT), and superoxide dismutase (SOD) in erythrocytes and erythrocyte glutathione (GSH) concentration expressed as a percentage of the mean baseline values in low Se group. Data are presented as a mean and SEM. *p < 0.05, **p < 0.01, ***p < 0.001—comparison between the low and high Se groups

