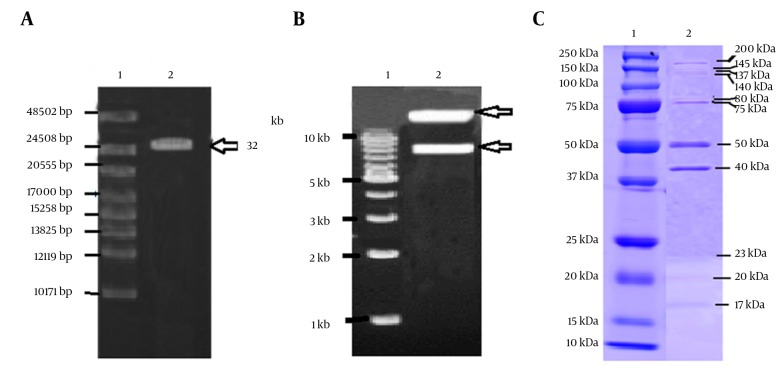
Figure 5. Results of Agarose Gel Electrophoresis and Sodium Dodecyl Sulfate Polyacrylamide Gel Electrophoresis.
A, The MJ1 phage genome, as detected by agarose (0.6%) gel electrophoresis. Lane 1 shows a high range DNA ladder (Gene Ruler) and lane 2 shows a band of phage DNA having a size of approximately 32 kb; B, Lane 1 shows a 1 kb DNA ladder (New England Biolabs) and lane 2 shows the MJ1 phage DNA restriction analysis with EcoR1; C, Image shows the SDS-PAGE analysis of the MJ1 phage structural proteins; lane 1 shows broad range protein molecular weight markers (Precision Plus ProteinTM , Bio-Red) and lane 2 shows the MJ1 phage proteins.

