

Abstract
NGP1-01 (8-benzylamino-8, 11-oxapentacyclo [5.4.0.02, 6.03, 10.05, 9] undecane) is a heterocyclic cage compound with multifunctional calcium channel blocking activity that has been demonstrated to be neuroprotective in several neurodegenerative models. A sensitive internal standard LC-MS/MS method was developed and validated to quantify NGP1-01 in mouse serum. The internal standard (IS) was 8-phenylethyl-8, 11-oxapentacyclo [5.4.0.0(2, 6).0(3, 10).0(5, 9)] undecane. Sample preparation involved a protein precipitation procedure by addition of acetonitrile. Chromatographic separation was carried out on a Phenomenex Kinetex phenyl-hexyl column (100 x 2.1 mm, 2.6 μm) employing a gradient (45% isocratic 3 min, 45% to 95% linear gradient 6 min, 95% isocratic 3 min) of an elution mobile phase of 5 mM ammonium acetate in 100% acetonitrile mixing with an application mobile phase of 5 mM ammonium acetate in 2% acetonitrile. Detection was achieved by a QTrap 5500 mass spectrometer (AB Sciex) employing electrospray ionization in the positive mode with multiple-reaction-monitoring (MRM) for NGP1-01 (m/z 266 → 91) and IS (m/z 280 → 105). The method validation was carried out in accordance with Food and Drug Administration (FDA) guidelines. The method had a linear range of at least 0.5–50 ng/mL with a correlation coefficient 0.999. The intra-assay and inter-assay precisions (%CV) were equal to or within the range of 1.0 to 4.3% and the accuracies (% relative error) equal to or within −2.5% to 3.4%. The analyte was stable for at least 2 months at −20°C, for at least 8 h at room temperature and for at least three freeze thaw cycles. The extraction recovery was 94.9 to 105.0%, with a %CV ≤ 9.5%. The technique was found to be free of any matrix effects as determined by experiments involving five different lots of mouse serum. Cross-talk interferences were not present. Two different gradient slope chromatography runs were done on dosed mouse serum samples to assess a possible positive error in peak area determination from in-source fragmentation of metabolites generating the same MRM transitions as the parent drug or IS. No such interference was found in the NGP1-01 peak, while a minor interference was identified in the IS peak. The optimized method was applied to the measurement of NGP1-01 in serum of dosed mice.
Keywords: NGP1-01, pentacycloundecylamine, neuroprotective agent, multifunctional drug, mouse serum, LC-MS/MS
1. Introduction
An increasingly important focus in drug discovery research in recent years is development of multifunctional drugs, agents with more than one therapeutic mechanism. A promising multifunctional agent which has shown neuroprotection in neurodegenerative disease systems is NGP1-01, the pentacycloundecylamine 8-benzylamino-8, 11-oxapentacyclo [5.4.0.02, 6.03, 10.05, 9] undecane. NGP1-01 (Fig. 1A) is a heterocyclic cage compound first characterized by the Van der Schyf group in the mid-1980s [1]. NGP1-01 has been shown to produce neuroprotective effects by inhibiting calcium uptake by acting as an uncompetitive antagonist of both the ligand-operated calcium channel [N-methyl-D-aspartate (NMDA) receptor] and the voltage-gated calcium channel in neuronal cells [2,3]. This inhibition prevents an increase in intracellular calcium, protecting against the excitotoxicity response that would lead to neuronal cell death by necrotic or apoptotic mechanisms caused by increased intracellular calcium [4–6]. NGP1-01 and derivatives of NGP1-01 have also been shown to have other functional protective effects pertinent to neurodegenerative diseases [7–11]. NGP1-01 is thus a promising therapeutic candidate for treatment of neurodegenerative disorders through its multimodal effects.
Figure 1.
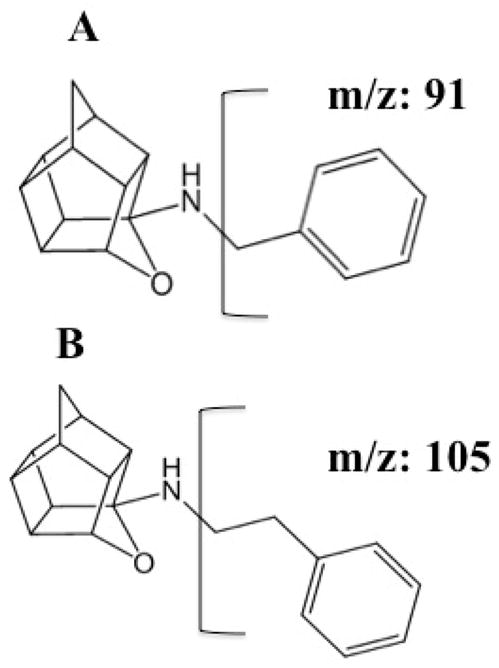
The chemical structures of NGP1-01 (A) and phenyl-ethyl-NGP1-01(IS) (B) showing fragmentation resulting in the positive daughter ions monitored in MRM.
Development of sensitive analytical methodology for its determination in biological samples is warranted. The only reported analytical method for NGP1-01 is a HPLC technique employing UV absorbance detection at 210 nm, which was applied to the determination of the compound in aqueous solutions assessing compound stability [12,13]. This technique is not applicable to biological samples because of the poor limit of detection and low analytical specificity inherent in absorbance detection. Although a LC-MS technique for NGP1-01 was reported in these references, the technique used was an out-of-date particle beam ionization technology and it was only used for mass spectral identification of the HPLC peak and not for the quantification of the compound.
The present work reports the development and validation of a sensitive and specific LC-MS/MS technique for NGP1-01, applied to the determination of NGP1-01 in mouse serum.
2. Experimental
2.1. Chemicals and Materials
NGP1-01 (Fig. 1A) and the internal standard (IS), 8-phenylethyl-8, 11-oxapentacyclo [5.4.0.0(2, 6).0(3, 10).0(5, 9)] undecane (phenyl-ethyl-NGP1-01) (Fig. 1B), were synthesized and purified [1,10]. Results of C, H, N elemental analysis of the purified NGP1-01 and IS were at most ± 0.4% from the expected percentages, indicating that the compounds were essentially pure. HPLC grade dimethyl sulfoxide (DMSO) and Optima LC/MS grade acetonitrile (ACN) were from Fisher Scientific (Fair Lawn, NJ, USA). ACS reagent grade ammonium acetate was from Sigma-Aldrich (St.Louis, MO, USA). HPLC grade water was from a Barnstead NANO pure water purification system with a Nanopure Diamond Pack Organic Free cartridge from Thermo Scientific (West Palm Beach, FL, USA). Mobile phases were filtered through 0.45μ membrane filters from Millipore (Billerica, MA, USA). Individual lots of mouse serum (Non Swiss Albino) were from Innovative Research (Novi, MI, USA). One-hour dosed serum samples (serum samples taken from the mouse after administration of the drug, in this case, one hour after administration of NGP1-01) were from four different mice. Animal procedures were carried out according to the procedure approved by the Animal Care and Use Committee (IACUC) at Northeast Ohio Medical University.
2.2. Stock and working DMSO solutions
Stock solutions of NGP1-01 and IS were prepared at a concentration of 1 mg/mL in DMSO. Serial dilutions of NGP1-01 stock solution with DMSO gave the corresponding working NGP1-01 solutions at concentrations of 10, 20, 40, 100, 200, 400 and 1000 ng/mL for the preparation of the calibration standards. In the same manner, other working NGP1-01 solutions were prepared with DMSO at concentrations of 24, 140 and 800 ng/mL for preparation of the quality control (QC) standards. The IS working solution at 100 ng/mL was prepared by dilution of the IS stock solution with DMSO. All stock and working solutions were stored at −20°C in amber glass vials.
2.3. Preparation/storage of calibration and QC working serum samples and storage of all serum samples
QC working serum samples were prepared using pooled commercial mouse serum consisting of a mixture of six lots. QC working serum samples of 1.2 (low), 7.0 (mid) and 40 (high) ng/mL were prepared by addition of 10μL of the appropriate working NGP1-01 solutions to 200 μL of serum. The serum for preparing the calibration working serum samples was either from different mouse serum lots or the pooled six lots of mouse serum, depending on what study was done, as specified in section 2.6. The calibration working serum samples of 0.5, 1, 2, 5, 10, 20, and 50 ng/mL were prepared by spiking 10μL of the appropriate working NGP1-01 solutions into 200 μL of the serum. The calibration and QC working serum samples were vortexed for 20 s and then stored at −20°C. Dosed serum samples and pooled and individual mouse serum lots were stored, as is, at −20°C.
2.4. Preparation of calibration standards, QC standards, blanks and dosed samples for analysis
The serum samples of section 2.3 were thawed and taken through the preparation steps given below to prepare the calibration standards, QC standards, blanks, dosed and any other prepared serum samples. A volume of 10 μL of IS working solution was added to 200 μL of each of the afore-mentioned serum samples (except the double blank) to give a final IS concentration of 5 ng/mL. Double blanks were prepared by adding 20 μL of ACN to 200 μL of serum without adding NGP1-01 and IS, where as single blanks were prepared by spiking 10 μL of IS working solution and 10 μL of ACN into 200 μL serum. Next, a protein precipitation step was done to all samples as follows. After a 20 s vortex, 800 μL of ACN was added to each sample, which was then sonicated for 10 min and centrifuged at 13,000 g for 20 min. The prepared sample supernatant was then transferred into HPLC autosampler vials for LC-MS/MS analysis.
2.5. LC-MS/MS analysis
The analysis was performed using a LC-MS-MS system in which a Shimadzu UPLC system (Columbia, MD, USA) was interfaced to an AB Sciex QTrap 5500 mass spectrometer equipped with an electrospray ionization source (Framingham, MA, USA). The UPLC system consisted of a Prominence DGU-20A3R inline degasser, two LC-30AD pumps, a SIL-30AC autosampler and a CBM-20A controller. Following the sample preparation described in section 2.4, 10 μL of each prepared sample supernatant was injected onto a Kinetex phenyl-hexyl column (100 x 2.1 mm, 2.6 μm) from Phenomenex (Torrance, CA, USA). The flow rate was 0.2 mL/min. An optimized gradient of application mobile phase A, 5 mM of ammonium acetate in 2% ACN, and elution mobile phase B, 5 mM of ammonium acetate in 100% ACN, was used. The gradient program used is given in Table 1. The run time for each injection was 12 min. The column was equilibrated for 10 min before each sample injection.
Table 1.
HPLC gradient programa
| Minutes | B% |
|---|---|
| 0–3 | 45 (isocratic) |
| 3–9 | 45–95 (linear) |
| 9–12 | 95 (isocratic) |
Mobile phase A is 5 mM ammonium acetate in 2% ACN and mobile phase B was 5 mM ammonium acetate in 100 % ACN.
Mass spectrometric analysis employed electrospray ionization in the positive mode with multiple reaction monitoring (MRM) at the transitions of m/z 266 → 91 for NGP1-01 and 280 → 105 for IS. The optimized MS parameters were as follows: ion spray voltage (5000 V), declustering potential (60 V), entrance potential (8 V), collision energy (40 V), collision exit potential (9 V), collision gas (N2 gas) and nebulizer temperature (450 °C). Data acquisition and processing were done using the Analyst software (version 1.6.1) from AB Sciex.
QC standards (1.2, 7 and 40 ng/mL) were included in all runs to confirm acceptable performance of the method.
2.6. Method validation
A complete bioanalytical method validation of NGP1-01 in mouse serum was done following FDA guidelines [14,15]. The analytical method was validated using either pooled mouse serum from six lots or different individual mouse serum lots, as specified below.
2.6.1. Linearity and Calibration
Calibration curves were established by plotting the peak area ratio of NGP1-01 to IS (y) versus the serum NGP1-01 concentration (pooled serum, section 2.3) in ng/mL (x) used to prepare the calibration standards (n=2 for each calibration standard). The slope and correlation coefficient of the calibration curve were calculated using a weighted (1/x) linear regression.
2.6.2. Interferences assessed by blank serum samples
Six double blanks were matched to six 0.5 ng/mL calibration standards, each prepared from six lots of serum, to determine the extent of any interfering chromatographic peaks compared to the signal response of the lowest calibration standard.
2.6.3. Precision and Accuracy
Precision and accuracy were evaluated by preparing and analyzing the 1.2, 7.0 and 40 ng/mL QC standards prepared with pooled mouse serum, performing intra–assay (within a day, n=5 for each QC standard, each individually prepared and analyzed) and inter-assay (five days, n=1 for each of the QC standards prepared and analyzed each day, n=5 total for each QC standard) assessments. Precision was determined as the coefficient of variation (%CV). Accuracy, calculated as relative error (%RE), was determined as the percent ratio of the difference of the experimentally measured concentrations of NGP1-01 in QC standards from its actual value divided by its actual value.
Precision and accuracy was assessed for the 0.5 ng/mL lowest calibration standard, prepared in six different lots, determined on different days (n=6 total).
2.6.4. Matrix Effect
The matrix effect was assessed as the percent ratio (%ME) of the experimentally determined NGP1-01 peak areas for serum samples spiked with NGP1-01 after sample preparation (1.0, 5.0, 50 ng/mL NGP1-01 after spiking) for each of five serum lots (n=1 for each lot, n=5 total) divided by the NGP1-01 peak areas for the same NGP1-01 concentrations prepared in 80% ACN in water (n=5, five different sets of NGP1-01 solutions prepared in 80% ACN). The serum-based samples were prepared as specified in sections 2.3 and 2.4.
The matrix effect was also assessed by comparing calibration plot slopes (n=5) determined for calibration standards (0.5, 1, 2, 5, 10, 20, and 50 ng/mL) prepared normally as given in sections 2.3 and 2.4 (NGP1-01 added prior to sample preparation), prepared with each of the five serum lots (n=1 for each calibration standard for each serum lot calibration). The precision of the five slopes (%CV) assesses the presence or absence of a relative matrix effect [16].
2.6.5. Extraction recovery
The extraction recovery was determined as the percent ratio (%ER) of the experimentally determined peak areas of NGP1-01 of prepared serum samples spiked with NGP1-01 prior to sample preparation (1.0, 5.0, 50 ng/mL NGP1-01 after spiking) divided by the peak areas of NGP1-01 of prepared serum samples spiked with NGP1-01 after sample preparation at the same three concentrations for each of the five serum lots (n=1 for each lot, n=5 total). Samples were prepared as given in sections 2.3 and 2.4.
2.6.6. Selectivity
In the assessment of cross-talk selectivity, a set of two serum samples were prepared and analyzed for each of the five serum lots. The two serum samples for each serum lot set were: NGP1-01 at 50 ng/mL in the serum lot without IS added and IS at 5 ng/mL in the serum lot without NGP1-01 added, prepared according to the procedure described in sections 2.3 and 2.4. LC-MS/MS was done for each prepared sample, with the signal monitored at the IS MRM channel for the NGP1-01 sample and at the NGP1-01 MRM channel for the IS sample
Assessment was also done for the presence of co-eluting metabolites that would experience a specific type of in-source fragmentation that would lead to a positive bias error in determining the area of the NGP1-01 and/or the IS peak. The particular type of in-source fragmentation is that which would generate compounds with the same MRM transitions as the parent drug NGP1-01 or IS. Experiments assessing this type of selectivity issue were done on four different one-hour dosed mouse serum samples (prepared as described in section 2.4, except IS was not added). In this study, LC-MS/MS analysis was performed on the dosed serum samples employing the following more selective shallower slope gradient in the chromatography: 10% mobile phase B (isocratic) 4 min, followed by a linear gradient to 95% mobile phase B in 18 min and then isocratic at 95% mobile phase B for 2 min. The same mobile phases A and B and flow rate were used, as specified in section 2.5. Detector response was monitored at both the NGP1-01 and IS MRM channels to see if additional peaks were noted which separated from the NGP1-01 and/or IS peaks in the shallow gradient chromatogram compared to the Table 1 gradient chromatogram. Such additional peaks would indicate the presence of this type of interfering co-eluting metabolite.
2.6.7. Stability
The stability of NGP1-01 in stored pre-preparation pooled serum samples spiked with NGP1-01 (QC working serum sample prior to section 2.4 preparation) was evaluated by determining QC standards at two different concentrations (1.2 and 40 ng/mL) prepared from the stored sample. The stability of NGP1-01 in these pre-preparation serum samples was tested for the following conditions: (1) short term stability at room temperature for 8 h, (2) long-term stability stored at −20°C for 60 days and (3) freeze-thaw stability through three freeze-thaw cycles for three consecutive days. Short term stability was also assessed for post-preparation QC standards (1.2 and 40 ng/mL) stored at room temperature for 10 h. All experiments were run in triplicate for each QC concentration. These experimental QC standard results were compared with the actual values, calculated as a percent ratio of the experimental divided by the actual.
The stock solution stabilities of NGP1-01 and IS were evaluated by comparing experimentally determined NGP1-01 concentrations of 1.2 and 40 ng/mL QC standards (n=3 for each) prepared from the NGP1-01 stock solution stored for nine months at −20 °C with the actual NGP1-01 values, calculated as a percent ratio of the experimental divided by the actual.
3. Results and discussion
3.1. Mass spectra and liquid chromatography
Infusion studies identified protonated parent molecular ions at m/z 266 and 280 for NGP1-01 and IS respectively, which generated predominant daughter ions at m/z 91 and 105 respectively. MRM transitions of m/z 266 → 91 for NGP1-01 and 280 → 105 for IS were thus chosen for quantification in this study. Infusion studies also identified minor abundant daughter ions at m/z 248 and 65 for NGP1-01 and 262, 159 and 79 for IS.
Various isocratic chromatographic schemes employing different concentrations of ACN or methanol were investigated, however the NGP1-01 and IS peaks were irregularly shaped and were not as well separated. Optimized resolution and good peak shapes for NGP1-01 and IS were achieved using the multi-part gradient of ACN in 5 mM ammonium acetate given in Table 1. Addition of ammonium acetate in the mobile phase not only enhanced the signals but also improved the peak shapes for both NGP1-01 and IS. No carryover was noted after a high concentration NGP1-01 run followed by a blank run.
Various gradient programs of methanol in 5 mM ammonium acetate were also evaluated. However the chromatographic performance was not as good as that obtained with the ACN gradient given in Table 1.
3.2. Linearity
A calibration plot of the peak area ratio of NGP1-01 over IS (y) versus NGP1-01 concentration in ng/mL (x) employing linear regression using a weighting factor of 1/x yielded y = 0.239x + 0.0185 with r = 0.9996, confirming linearity in the range of 0.5–50 ng/mL. The lowest calibration standard of 0.5 ng/mL in the present work (0.1 ng/mL injected) is three orders of magnitude better than the limit of detection of the only published HPLC technique for NGP1-01 [12]. The actual detection limit and limit of quantification is much lower (better) for the present technique, given that the signal/noise detector response for this 0.5 ng/mL calibration standard is high [see Fig 2B (1 and 2)].
Figure 2.

Representative chromatograms for a double blank (A1 and A2) and a 0.5 ng/mL NGP1-01/ 5 ng/mL IS calibration standard (B1 and B2) at MRM channels for NGP1-01 (A1, B1) and phenyl-ethyl-NGP1-01 (IS) (A2, B2) to show absence of interfering peaks at the NGP1-01 and IS retention times.
3.3. Interferences assessed by blank serum samples
Chromatographic interfering peaks of this method were evaluated by comparative analysis of the lowest calibration standard (0.5 ng/mL) matched with double blanks prepared from six lots of serum. As shown in a representative chromatogram [Fig. 2A (1 and 2)], there were no interfering peaks at the retention times of NGP1-01 and IS of 5.52 and 4.51 min, respectively (Fig. 2B).
3.4. Precision and accuracy
Intra- and inter-assay precisions (%CV) and accuracies (%RE) were evaluated by analyzing five replicates of low, mid and high QC standards. As summarized in Table 2, the intra- and inter-assay accuracy %RE, considered together, ranged from −2.5% to 3.4%, while the %CV were ≤ 4.3%. These values are within the acceptable limits according to FDA guidelines. The accuracy (%RE) and precision (%CV) for the lowest calibration standard (0.5 ng/mL) were 1.8% and 3.5% respectively.
Table 2.
Precision and accuracy of intra-assay and inter-assay for the quantification of NGP1-01 in mouse serum (n=5, pooled serum sample)
| Intra-Assay
|
Inter-Assay
|
||||||
|---|---|---|---|---|---|---|---|
| Actual NGP1-01 conc. (ng/mL) | Measured NGP1-01 conc. (ng/mL) Mean ±SD |
Precision %CVa | Accuracy %REb | Measured NGP1-01 conc. (ng/mL) Mean ±SD |
Precision %CVa | Accuracy %REb | |
|
|
|
||||||
| Low QC | 1.2 | 1.17±0.02 | 1.7 | −2.5 | 1.17±0.01 | 1.1 | −2.5 |
| Mid QC | 7.0 | 7.24±0.07 | 1.0 | 3.4 | 7.05±0.09 | 1.3 | 0.7 |
| High QC | 40 | 39.2±1.7 | 4.3 | −2.0 | 40.3±0.7 | 1.7 | 0.8 |
%CV = (Standard Deviation/Mean) x 100%
%RE = [(Measured – Actual)/Actual] x 100%
3.5. Matrix effect
The matrix effect was assessed in two ways: by comparing the NGP1-01 peak area results of samples with NGP1-01 added after sample preparation to that of the NGP1-01 in 80% ACN solutions, expressed as percent ratio (%ME) [17] and by determining the precision in the slope of a set of calibration plots [16]. Both ways assess the relative matrix effect because experiments are done using multiple serum lots [16,17]. The use of five different serum lots assures a broader evaluation of a matrix interference because different serum samples may contain different interfering matrix components or have the same matrix components at a different concentration. The %ME results are given in Table 3. The %ME range was 97.7–101.5%, indicating the absence of a matrix interference.
Table 3.
% Matrix Effect (%ME) of NGP1-01 in mouse serum (n=1 for each serum lot, n=5 total)
| NGP1-01 conc. (ng/mL) | Mean % Matrix Effect (%MEb) ± SD (%) | CV%a |
|---|---|---|
| 1.0 | 101.0±4.4 | 4.3 |
| 5.0 | 101.5±0.7 | 0.7 |
| 50 | 97.7±4.6 | 4.8 |
CV% = (Standard Deviation/Mean) x 100%
%ME = (Peak area of NGP1-01 in serum*)/(peak area of NGP1-01 in 80% ACN) * 100%
spiked after sample preparation
In addition to %ME, Matuszewski published a procedure for assessing the relative matrix effect by comparing the slopes of calibration curves [(peak area analyte)/(peak area IS) versus concentration analyte] for calibration standards prepared in five lots of serum [16]. The slopes are expected to be different if the matrix effect differs in the different lots. This difference can be quantified by calculating the %CV of the slopes for the different lot calibration curves. The %CV for the slopes of the five calibration curves [(peak area NGP1-01)/(peak area IS) versus concentration NGP1-01] done in the present work was 3.9%, which is within the limits (< 3–4%) for the method to be judged free of matrix interferences [16].
Furthermore, a similar analysis of the data from the five sets of NGP1-01/IS calibration solutions prepared in 80% ACN solution yielded a %CV of 4.9% for the slopes, indicating that the slope imprecision for the serum-based calibration standards was not more than that of the set of NGP1-01/IS solutions in 80% ACN. Also, there was essentially no difference in the average slope of calibration plots of the serum-based calibration standards compared to that of the ACN solutions (2.3 % difference), further supporting the conclusion of the absence of matrix effect in the serum.
3.6. Extraction recovery
Values for %ER were determined for three NGP1-01 concentrations as a percent ratio of NGP1-01 peak areas for pre- divided by post-preparation addition of NGP1-01 serum samples in five serum lots. As indicated in Table 4, excellent recoveries were obtained for the three concentrations of NGP1-01 in serum. The %ER values were 94.9 – 105.0%, with a %CV ≤ 9.5%.
Table 4.
Extraction recovery of NGP1-01 in mouse serum (n=1 for each serum lot, n=5 total)
| NGP1-01 conc. (ng/mL) | Mean extraction recovery (ER)b ± SD (%) | CV%a |
|---|---|---|
| 1.0 | 95.1±6.8 | 7.2 |
| 5.0 | 94.9±1.7 | 9.5 |
| 50 | 105.0±9.7 | 9.2 |
CV% = (Standard Deviation/Mean) x 100%
3.7. Selectivity Assessments
3.7.1. Cross-talk between MRM channels
The selectivity in terms of cross-talk was also assessed [17]. Prepared NGP1-01 serum samples (50 ng/mL, no IS added) and IS serum samples (5 ng/mL, no NGP1-01 added) were analyzed and the response measured at the IS and NGP1-01 MRM channels, respectively. None of the chromatograms for the five serum lots showed peaks in the other MRM channel for either the solely added IS or NGP1-01 samples, indicating that there is no cross-talk (see Fig. 3).
Figure 3.

Representative chromatograms of experiments assessing presence of cross talk between the NGP1-01 and the phenyl-ethyl-NGP1-01 (IS) MRM channels. Chromatograms of NGP1-01 (prepared 50 ng/ml NGP1-01 serum sample without IS) (A1 and A2) and IS (prepared 5 ng/ml IS serum sample without NGP1-01) (B1 and B2) monitored at the MRM channels for NGP1-01 (A1, B1) and IS (A2, B2).
3.7.2. Assessing a possible interference from in-source fragmentation of metabolites
A representative chromatogram of a dosed NGP1-01 serum sample using the Table 1 gradient is shown in Fig 4A. Previous investigators have identified examples of in-source collision induced dissociation of drug metabolites that yield a fragmented metabolite having an identical MRM transition as that of the parent drug [18,19]. This will lead to a positive error for the determination of the parent drug in the dosed serum samples if the metabolite co-elutes with the parent drug peak. Previous reports have employed shallow gradients leading to a more selective chromatography to separate these metabolite compounds from the parent drug peaks in order to assess this type of error bias [19,20]. If such an interference is present then it is likely that an additional MRM peak will be noted in the chromatogram in the shallower gradient run, separating out from the analyte and/or IS peak. This should be investigated for both the parent drug and the IS MRM channels.
Figure 4.

Representative chromatograms in experiments assessing presence of in-source metabolite fragmentation interference. Chromatograms employing Table 1 gradient of a one hour dosed serum sample at 12 ng/mL NGP1-01 diluted 4 fold with commercial mouse serum prior to sample preparation [diluted sample is 3 ng/mL NGP1-01 and 5 ng/mL phenyl-ethyl-NGP1-01 (IS)] (A1, A2). Chromatograms employing shallow gradient (section 2.6.6) of prepared one-hour dosed serum sample at 12 ng/mL NGP1-01 (not diluted) with no IS added. The MRM channels for NGP1-01 are in the left column chromatograms (A1, B1) and for IS are in the right column chromatograms (A2, B2).
In the present work, the more selective shallow gradient chromatography differed from the Table 1 gradient as follows: (1) it initiated the gradient at a lower ACN concentration (10% B compared to 45% B for the Table 1 gradient) and (2) it employed a shallower gradient (the slope was approximately half of the Table 1 gradient). The chromatogram for the NGP1-01 MRM channel (Fig. 4B1) obtained with this shallow gradient shows no significant additional peaks, even when examined at a more sensitive scale for the figure. Thus metabolite interference via an in-source collision induced dissociation is not indicated in the NGP1-01 peak.
A representative chromatogram (Fig. 4B2) for the IS MRM channel (noting that no IS has been added to the sample) shows additional peaks that were not seen in the serum lot blank’s IS MRM channel. These additional peaks may be in-source generated NGP1-01 fragmentation metabolites that have IS MRM transitions or may be other compounds in the serum of the dosed mice that are not in the commercial serum lots. It should be noted that the late eluting additional peak at 16.18 min in the shallow gradient run chromatogram (Fig. 4B2) was also noted in the Table 1 gradient run chromatogram at 8.6 min (although time beyond 8 min was not done for the run in Fig. 4A2, other longer runs showed this additional peak). This late eluting peak is sufficiently resolved in both gradients from the IS peak (12.41 and 4.44 min in the shallow gradient and Table 1 gradient, respectively) and is thus not an interference because it does not co-elute with IS. However, the 12.15 min interfering peak in Fig. 4B2 for the shallow gradient undoubtedly co-elutes with the IS peak in both the shallow and Table 1 gradient runs. The peak height for this interference ranged from 4000 – 1.5 x 10⁴ cps or 2.7% – 10% of the 5 ng/mL IS peak height (1.5 x 10⁵ cps) for the four dosed serum samples. It is thus only a minor interference in the IS peak, at least for the one-hour time point dosed serum samples. More extensive metabolite studies are warranted for future work.
3.8. Stability
The stability of NGP1-01 in serum was determined for different storage conditions, comparing the experimental results for QC standards prepared from stored serum samples spiked with NGP1-01 with actual values, calculated as a percent ratio. As summarized in Table 5, all stored pre-preparation QC working serum samples were found to be stable. All results for the QC working serum samples subject to the various storage conditions were equal to or within the range of 96.6–102.3%, including: (1) stored at room temperature for 8 h; (2) stored at −20°C for 2 months and (3) after 3 freeze-thaw cycles. Post-preparation NGP1-01 samples were also found to be stable after storing at room temperature for 10 hours (96.6–101.5%, see Table 5). The stability of NGP1-01 stock solution stored for 9 months at −20 °C was determined to be 97.8 – 98.8%, with a %CV of 0.4–0.5%, as determined from the analysis of two QC standards (1.2 and 40 ng/mL) prepared from the stored stock solution. These results indicate that NGP1-01 was stable for the experiments undertaken in the present work.
Table 5.
Stability studies of NGP1-01 in mouse serum pre- and post-preparation (QC standards) (n=3, pooled serum sample)
| Stored sample | Actual NGP1-01 conc. (ng/mL) | Measured NGP1-01 conc. (ng/mL) Mean ± SD |
Stability (%Recoverya) | |
|---|---|---|---|---|
| 2 months at − 20°C (Pre- preparation) | Low | 1.2 | 1.17±0.04 | 97.5 |
| High | 40 | 40.9±0.7 | 102.3 | |
| 3 Freeze thaw cycles (Pre- preparation) | Low | 1.2 | 1.16±0.01 | 96.6 |
| High | 40 | 40.3±0.4 | 100.8 | |
| 10 hr at RT (Post- preparation) | Low | 1.2 | 1.16±0.05 | 96.6 |
| High | 40 | 40.6±0.2 | 101.5 | |
| 8 hr at RT (Pre- preparation) | Low | 1.2 | 1.17±0.02 | 97.5 |
| High | 40 | 40.2±0.2 | 100.5 |
%Recovery = (Measured / Actual) x 100%
3.9. Method applicability to pharmacokinetic studies
This validated LC-MS/MS assay was successfully applied for the determination of NGP1-01 in dosed serum samples at a one hour time point for four different mice. The mice were given a single dose of NGP1-01 at 20 mg/kg by intraperitonial administration. This 20 mg/kg dosing was established by previous mouse studies showing significant neuroprotective effects [11,21]. The measured mean concentration NGP1-01 in serum for the four mice at the one hour time point was found to be 19.5 ng/mL, with a standard deviation of ± 9.2.
4. Conclusion
A rapid and sensitive internal standard LC-MS/MS method has been developed and validated for the quantitative measurement of NGP1-01 in mouse serum. A simple protein precipitation method was used to prepare samples. The method employed a phenyl-hexyl reversed phase HPLC column for separation of the analyte and the internal standard and a MRM detection mode for sensitive and selective detection of the compounds. An ACN gradient with addition of ammonium acetate to the mobile phase was found to give good chromatographic performance in terms of resolution and peak shape. The assay gave a linear calibration range of at least 0.5 – 50 ng/mL. The intra and inter-assay precision and accuracy of this method are well within the FDA guideline limits. NGP1-01 in serum was found to be stable under different storage conditions. The technique was assessed and found to be free of any matrix effect as determined by experiments involving five different lots of serum. In–source fragmentation metabolite interferences were not noted in the NGP1-01 peak, while a minor possible fragmentation metabolite interference was noted in the IS peak. This method was applied to quantify NGP1-01 in limited number of dosed mouse serum samples to show the suitability for undertaking full NGP1-01 pharmacokinetic studies.
Highlights.
First reported LC-MS/MS technique for the quantification of NGP1-01
Method was validated for determination of NGP1-01 in mouse serum according to FDA Bio Analytical Method Guidelines
Ammonium acetate in the mobile phase enhanced the signal and improved the peak shapes of analyte and internal standard
Acknowledgments
The authors acknowledge the following sources of support for this work:
“Bloomberg Foundation, Youngstown, Ohio” supported the synthesis of NGP-01 and the purchase and preparation of the mice
“Fight for Sight Inc.” supported the synthesis of NGP-01 and the purchase and preparation of the mice
“The National Science Foundation Major Research Instrumentation Grant (CHE-0923398)” supported the requisition of the AB Sciex QTrap 5500 mass spectrometer instrument.
Abbreviations
- ACN
acetonitrile
- %CV
coefficient of variation
- DMSO
dimethyl sulfoxide
- %ER
extraction recovery
- FDA
Food and Drug Administration
- IS
internal standard
- phenyl-ethyl-NGP1-01
8-phenylethyl-8,11-xapentacyclo[5.4.0.0(2,6).0(3,10).0(5,9)]undecane
- %ME
matrix effect
- MRM
multiple reaction monitoring
- NGP1-01
8-benzylamino-8, 11-oxapentacyclo [5.4.0.02, 6.03, 10.05, 9] undecane
- NMDA receptor
N-methyl-D-aspartate receptor
- QC
quality control
- %RE
relative error
- SD
standard deviation
References
- 1.Van der Schyf CJ, Squier GJ, Coetzee WA. Pharmacol Res Commun. 1986;18:407–417. doi: 10.1016/0031-6989(86)90162-1. [DOI] [PubMed] [Google Scholar]
- 2.Kiewert C, Hartmann J, Stoll J, Thekkumkara TJ, Van der Schyf CJ, Klein J. Neurochem Res. 2006;31:395–399. doi: 10.1007/s11064-005-9036-0. [DOI] [PubMed] [Google Scholar]
- 3.Geldenhuys WJ, Malan SF, Bloomquist JR, Van der Schyf CJ. Bioorg Med Chem. 2007;15:1525–1532. doi: 10.1016/j.bmc.2006.09.060. [DOI] [PubMed] [Google Scholar]
- 4.Kristián T, Siesjö BK. Stroke. 1998;29:705–718. doi: 10.1161/01.str.29.3.705. [DOI] [PubMed] [Google Scholar]
- 5.Lipton P. Physiol Rev. 1999;79:1431–1568. doi: 10.1152/physrev.1999.79.4.1431. [DOI] [PubMed] [Google Scholar]
- 6.LaFerla FM. Nat Rev Neurosci. 2002;3:862–872. doi: 10.1038/nrn960. [DOI] [PubMed] [Google Scholar]
- 7.Gaasch JA, Geldenhuys WJ, Lockman PR, Allen DD, Van der Schyf CJ. Neurochem Res. 2007;32:1686–1693. doi: 10.1007/s11064-007-9313-1. [DOI] [PubMed] [Google Scholar]
- 8.Lockman JA, Geldenhuys WJ, Jones-Higgins MR, Patrick JD, Allen DD, Van der Schyf CJ. Brain Res. 2012;1489:133–139. doi: 10.1016/j.brainres.2012.10.029. [DOI] [PubMed] [Google Scholar]
- 9.Geldenhuys WJ, Terre’Blanche G, Van der Schyf CJ, Malan SF. Eur J Pharmacol. 2003;458:73–79. doi: 10.1016/s0014-2999(02)02701-2. [DOI] [PubMed] [Google Scholar]
- 10.Geldenhuys WJ, Malan SF, Murugesan T, Van der Schyf CJ, Bloomquist JR. Bioorg Med Chem. 2004;12:1799–1806. doi: 10.1016/j.bmc.2003.12.045. [DOI] [PubMed] [Google Scholar]
- 11.Hao J, Mdzinarishvili A, Abbruscato TJ, Klein J, Geldenhuys WJ, Van der Schyf CJ, Bickel U. Brain Res. 2008;1196:113–120. doi: 10.1016/j.brainres.2007.11.075. [DOI] [PubMed] [Google Scholar]
- 12.du Preez JL, Lötter AP. Drug Dev Ind Pharm. 1996;22:1249–1252. [Google Scholar]
- 13.du Preez JL, Lötter AP, Guillory JK. Pharmazie. 1996;51:223–227. [Google Scholar]
- 14.Bansal S, DeStefano A. AAPS J. 2007;9:E109–E114. doi: 10.1208/aapsj0901011. [DOI] [PMC free article] [PubMed] [Google Scholar]
- 15.FDA Bio Analytical Method Guidelines for Industry. U.S. Department of Health and Human Services, Food and Drug Administration; May, 2001. www.fda.gov/downloads/Drugs/Guidances/ucm070107.pdf. [Google Scholar]
- 16.Mastuszewski BK. J Chromatogr B Anal Technol Biomed Life Sci. 2006;830:293–300. doi: 10.1016/j.jchromb.2005.11.009. [DOI] [PubMed] [Google Scholar]
- 17.Mastuszewski BK, Constanzer ML, Chavez-Eng CM. AnalChem. 2003;75:3019–3030. doi: 10.1021/ac020361s. [DOI] [PubMed] [Google Scholar]
- 18.Jemal J, Xia Y-Q. Rapid Commun Mass Spectrom. 1999;13:97–106. doi: 10.1002/(SICI)1097-0231(19990815)13:15<1611::AID-RCM683>3.0.CO;2-C. [DOI] [PubMed] [Google Scholar]
- 19.Liu DQ, Pereira T. Rapid Commun Mass Spectrom. 2002;16:142–146. doi: 10.1002/rcm.549. [DOI] [PubMed] [Google Scholar]
- 20.Yan Z, Maher N, Torres R, Cotto C, Hastings B, Dasgupta M, Hyman R, Huebert N, Caldwell GW. Rapid Commun Mass Spectrom. 2008;22:2021–2028. doi: 10.1002/rcm.3577. [DOI] [PubMed] [Google Scholar]
- 21.Mdzinarishvili A, Geldenhuys WJ, Abbruscato TJ, Bickel U, Klein J, Van der Schyf CJ. Neurosci Lett. 2005;383:49–53. doi: 10.1016/j.neulet.2005.03.042. [DOI] [PubMed] [Google Scholar]