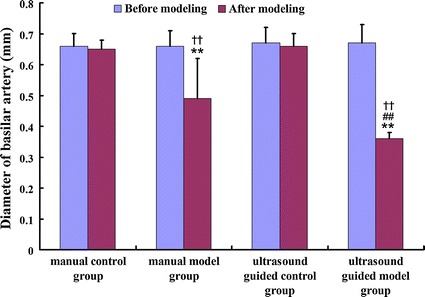
Fig. 6.

Comparison of basilar artery diameter among four groups. **Compare with the diameter before modeling, P < 0.05. ##Compare with the diameter in the manual group, P < 0.05. ††Compare with the diameter in the control group, P < 0.05

Comparison of basilar artery diameter among four groups. **Compare with the diameter before modeling, P < 0.05. ##Compare with the diameter in the manual group, P < 0.05. ††Compare with the diameter in the control group, P < 0.05