
Fig. 1.
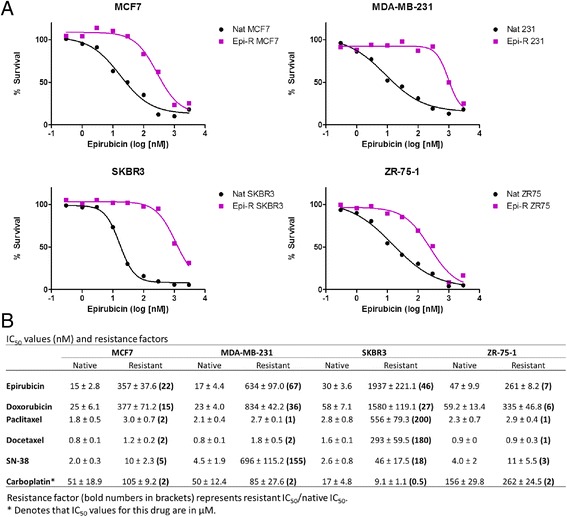
Characterisation of epirubicin-resistant cell lines. Native and resistant cells were exposed to drug concentrations ranging from 0.3 to 3000 nM. Cell viability was determined 72 h later by Cell Counting Kit-8 assay. a Percentage of live cells relative to dimethyl sulphoxide control was plotted against epirubicin concentration. Black = native cells, magenta = resistant cells. b Half-maximal inhibitory concentration (IC50) values in nanomolar concentrations ± standard deviation. Resistance factor is shown in parentheses and represents resistant IC50/native IC50