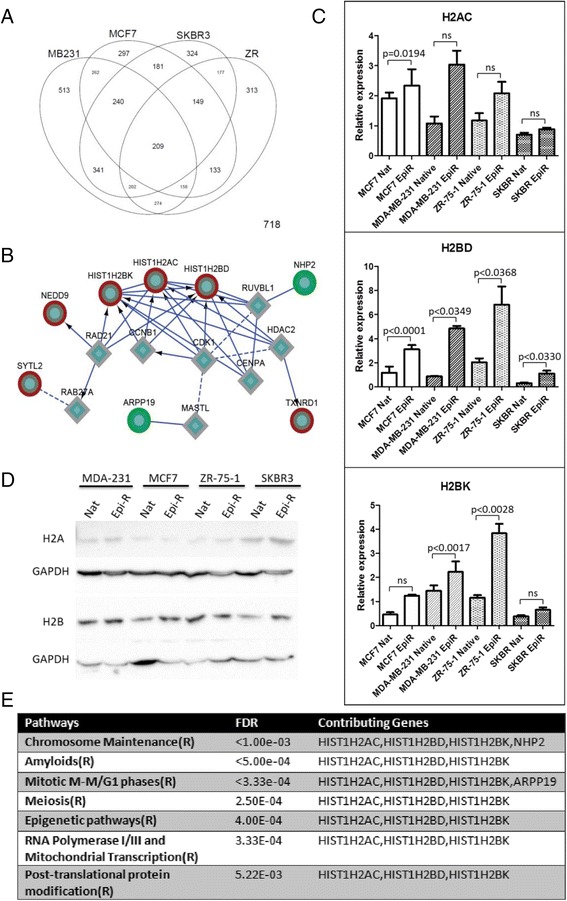
Fig. 4.

Network-based analysis of epirubicin-resistant (EpiR) cell lines. a Venn diagram of genes with significant changes in expression in breast cancer cell lines. b Histone module identified in Functional Interaction network analysis. Coloured rings denote genes demonstrating consistent changes across all four cell lines. Red rings = upregulated genes, green rings = downregulated genes, diamonds = linker genes. c Quantitative real-time polymerase chain reactions performed on RNA isolated from native and epirubicin-resistant cell lines. Bar graphs indicate average quantitative means, while error bars represent standard error of the mean. p Values were calculated using unpaired t test. ns non-significant. d Immunoblotting of total H2A and H2B histone proteins in native and epirubicin-resistant cell lines. Glyceraldehyde-3-phosphate dehydrogenase (GAPDH) was used as a housekeeping control. e Reactome pathways significantly enriched within the module shown in (b)
