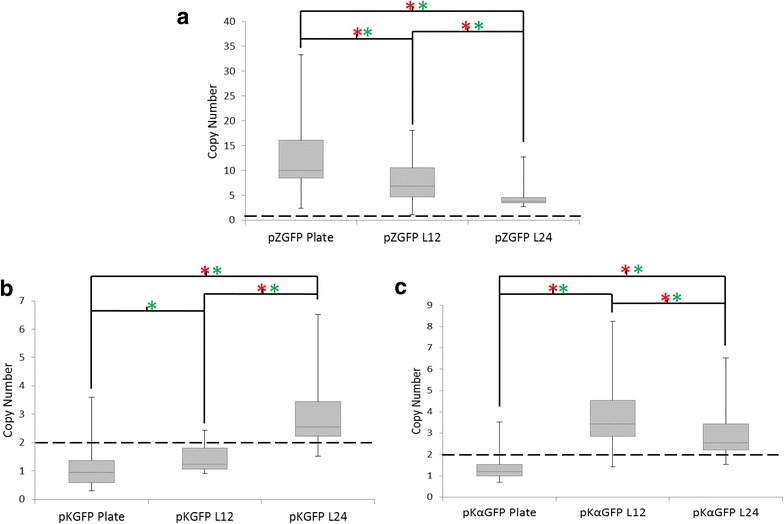
Fig. 2.

Comparison of copy number after liquid PTVA and plate PTVA. Box plots of final copy numbers after PTVA of traditional plate PTVA (Plate), 12 h liquid PTVA (L12) and 24 h liquid PTVA (L24). The box plots indicate the first quartile, median and third quartile, with the whiskers indicating the minimum and maximum (n = 20 for each condition). Copy number was determined by qPCR. The dashed line indicates the initial copy number of the starting clone. Red asterisks indicate significant comparisons according to Kruskal-Wallis one-way analysis of variance (p ≤ 0.05) and green asterisks indicate significant comparisons of the median according to Wilcoxon-Mann-Whitney test (p ≤ 0.05). a pPICZ-GFP-1 with a starting copy number of one. b pKAN-GFP-2 with a starting copy number of two. c pKANα-GFP-2 with a starting copy number of two
