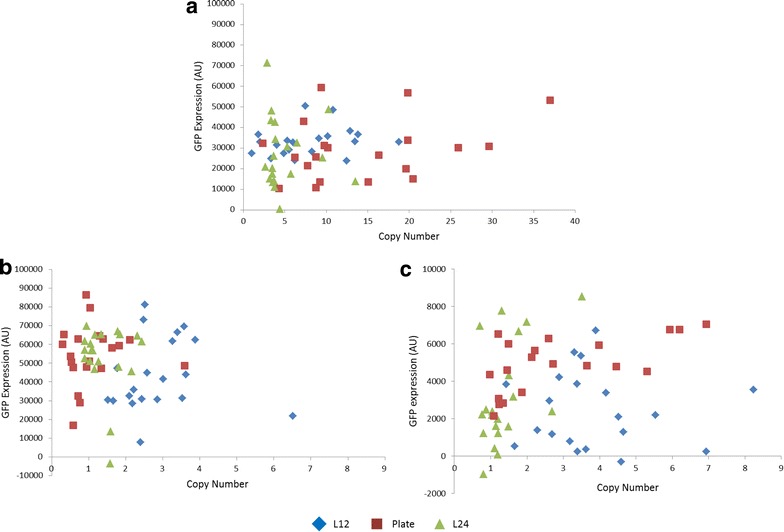
Fig. 3.

Comparison of GFP expression from strains of different copy numbers created using different PTVA methods. Copy number was measured using qPCR and GFP expression by fluorescence. All three methods of PTVA are presented on each graph, liquid 12 h (L12), liquid 24 h (L24) and traditional plate PTVA. a pZGFP-1. b pKGFP-2. c pKαGFP-2
