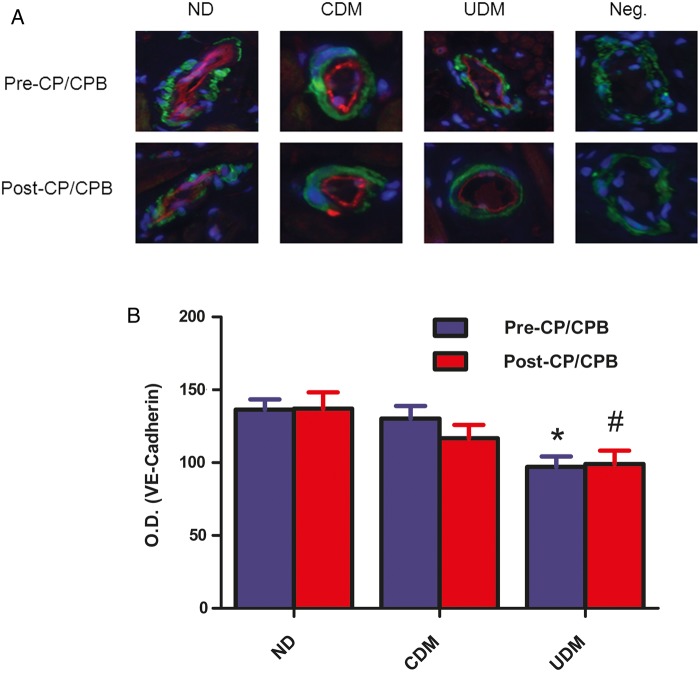
Figure 4:
(A) Immunolocalization of VE-cadherin in human atrial myocardium (magnification, 200×). Tissue slices were doubly stained for VE-cadherin (red), and α-actin (green). Negative controls documented a low level of background fluorescence (red), a strong signal of smooth muscle α-actin staining (green) and a signal of nuclear staining (blue); (B) VE-cadherin density analysis; *P = 0.08 versus ND-pre-CP/Rep; #P < 0.05 versus ND-post-CP/Rep; n = 8/group.

