Fig. 1.

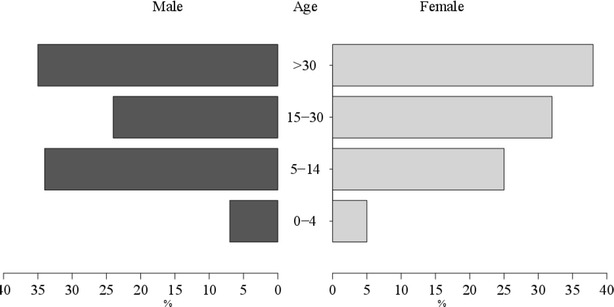
Gender and age group. Percentages of male and female populations are shown for the indicated age groups in black and grey horizontal bars, respectively

Gender and age group. Percentages of male and female populations are shown for the indicated age groups in black and grey horizontal bars, respectively