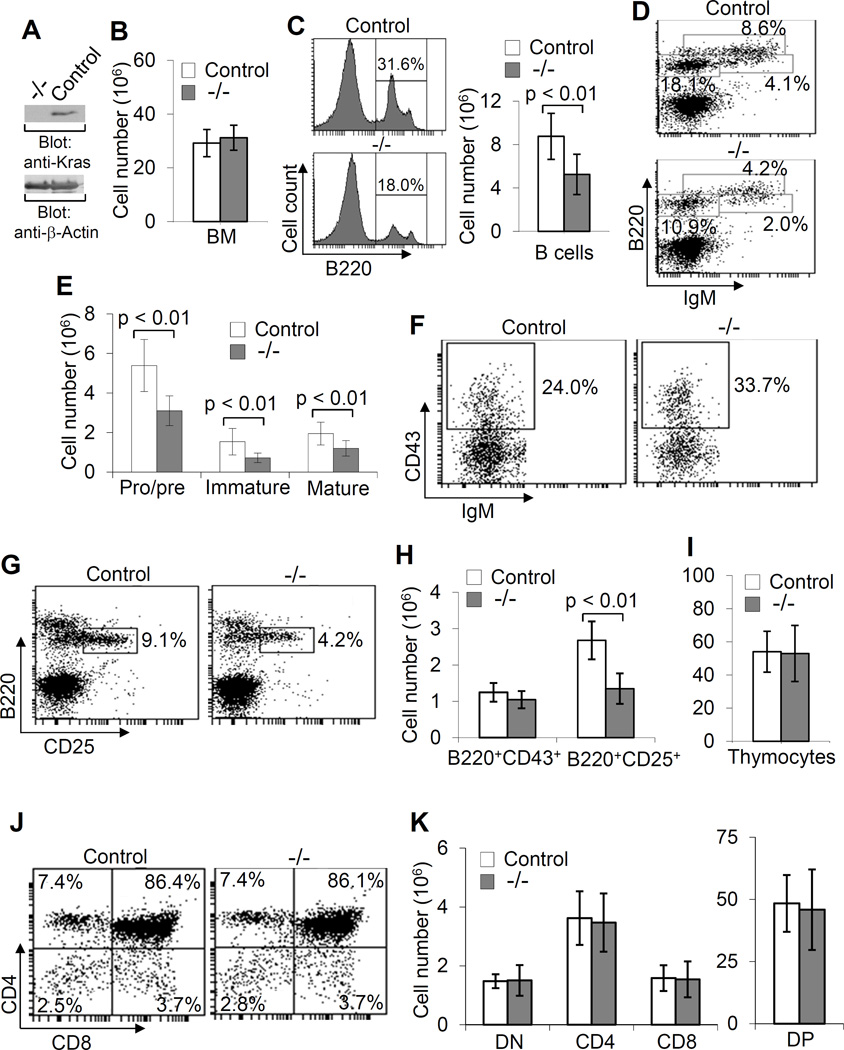
Figure 2.
Impaired early B cell development in VavCreKrasfl/fl mice. Direct Western blot analysis of cell lysates from BM cells of VavCreKrasfl/fl (−/−) and control (control) mice with the indicated antibodies demonstrates complete deletion of Kras in BM cells of VavCreKrasfl/fl mice (A). Bar graphs show the numbers of total BM cells isolated from two femurs of VavCre Krasfl/fl and control mice (B). Histograms and bar graphs show the percentages and numbers of total B cells in BM of VavCreKrasfl/fl and control mice (C). BM cells from VavCreKrasfl/fl and control mice were stained with anti-B220 and anti-IgM and percentages indicate cells in the gated live cells (D). Bar graphs show the numbers of pro/pre-, immature and mature B cells in BM (E). BM cells from VavCreKrasfl/fl and control mice were stained with anti-B220, anti-IgM and anti-CD43 and percentages indicate pro-B cells (IgM−CD43+) in the gated B220+IgM− population (F). BM cells from VavCreKrasfl/fl and control mice were stained with anti-B220 and anti-CD25 and percentages indicate pre-B cells (B220+CD25+) in the gated live cells (G). Bar graphs show the numbers of pro- and pre-B cells in the BM of VavCreKrasfl/fl and control mice (H). Bar graphs show the numbers of total thymocytes in VavCreKrasfl/fl and control mice (I). Thymocytes from VavCreKrasfl/fl and control mice were stained with anti-CD4 and anti-CD8 and percentages indicate cells in the gated live cells (J). Bar graphs show the numbers of DN, DP and SP T cells in the thymuses of VavCreKrasfl/fl and control mice (K). Data shown are obtained from or representative of 10 (B–H) or 8 (I–K) VavCreKrasfl/fl and 11 (B–H) or 9 (I–K) control mice.

