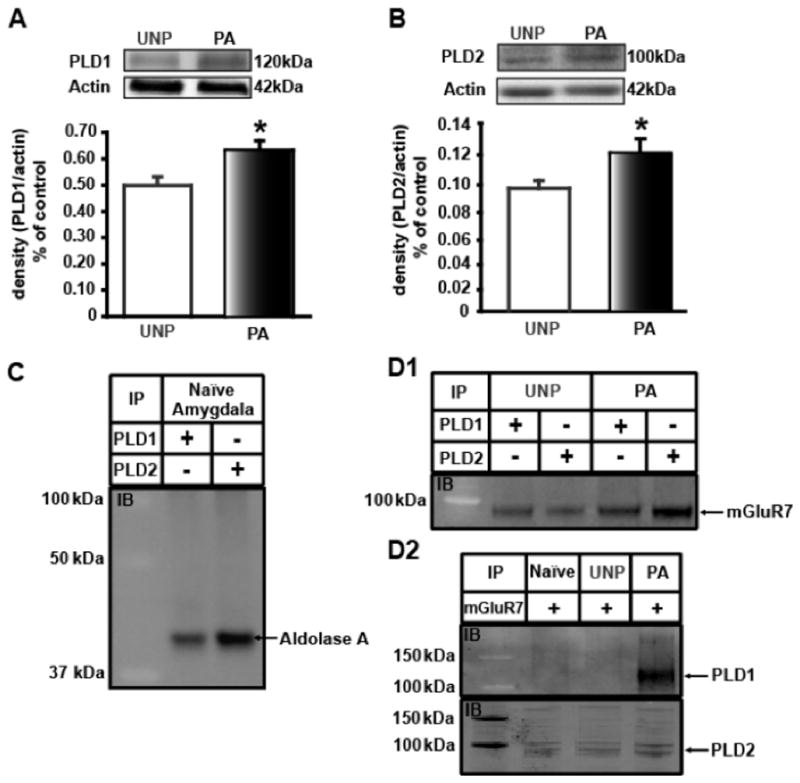
Figure 2.

FPS increases amygdala PLD expression. Protein expression relative to the loading control is plotted along the Y-axis. Representative immunoblots are shown in the panels above graph. A) Western blot analysis of whole amygdala homogenate show a significant increase in PLD1 protein expression (by 28%) in the PA group (black bar) compared to UNP animals (white bar). B) Western blot analysis of amygdala crude synaptosomal fractions indicated a significant increase in PLD2 protein expression (by 20%) in the PA group (black bar) compared to UNP animals (white bar). C) Immunoprecipitation (IP) with either PLD1 or PLD2 antibody using naïve amygdala crude synaptosomal fractions was immunoblotted (IB) with Aldolase A antibody. D1) IP with PLD1 or PLD2 antibody using UNP or PA amygdala crude synaptosomal fractions (top panel) immunoprecipitates mGluR7 but not mGluR4 (not shown). D2) The reciprocal experiment using mGluR7 antibody immunoprecipitates PLD1 only in the PA group while PLD2 is pulled down in all three animal groups. The molecular weight markers using protein standards are depicted in kDa in the far left lane of the IP experiments (C, D). * denotes significant difference (p<0.05) compared to UNP.
