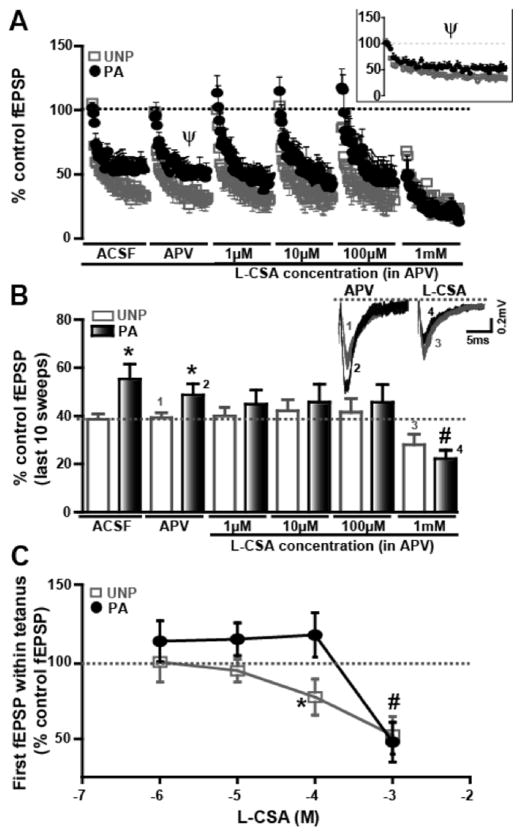
Figure 6.
The PLD-mGluR agonist inhibits fEPSPs during a 10Hz tetanus in the UNP group A) fEPSP amplitudes induced by 5 s tetani (10 Hz) are plotted at different concentrations of the PLD-mGluR agonist, L-CSA. APV (50 μM) is added to block L-CSA activation of NMDA receptors. fEPSP amplitude is % of baseline control. Inset shows expanded version of graph indicated by Ψ in A. PA is represented by black circles while UNP group is indicated by light grey squares. B) Bar graph plots of fEPSP magnitudes evoked by the last 10 stimuli within the 5 s tetanus show that L-CSA at 1 mM concentration has a pronounced inhibitory effect on the last 10 sweeps of fEPSPs in the PA group (dark bars) and UNP group (white bars). Representative traces depict the differences observed between the two groups, where the numbers correspond to the bars that they represent. C) A significant decrease in the first fEPSP is observed in PA (black circles) as well as UNP (light grey squares) groups at higher concentrations of L-CSA. * represents significant difference (p<0.05) between PA and UNP groups; # denotes significant difference (p<0.05) between L-CSA 100 μM and 1 mM in the PA group.

