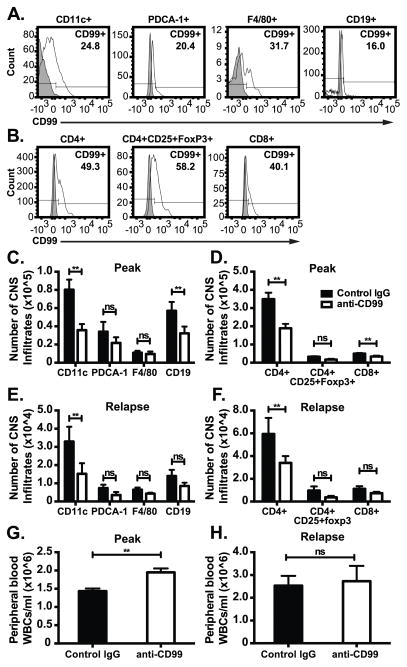
Figure 3. Inhibiting CD99 function prevents accumulation of inflammatory infiltrates in the CNS of RR-EAE mice.
(A) The percentage of CD45hi infiltrating iDCs (CD11b+CD11c+Ly6chi), macrophages (CD11b+CD11c−F4/80+), plasmacytoid DCs (CD11b−CD11c+PDCA-1+) and B-cells (CD19+), and (B) T-helper cells (CD3+CD4+), cytotoxic T-cells (CD3+CD8+) and T-regulatory cells (CD3+CD4+CD25+Foxp3+) expressing CD99 from the brain and spinal cord of individual mice at disease peak was quantitated by FACS. Histograms are representative of 5 individual mice. Filled bar indicates fluorescence minus one control and open line represents CD99 expressing cells. (C–F). The number of CD45hi infiltrating CD11c+ iDCs, F4/80+ macrophages, PDCA-1+ plasmacytoid DCs and CD19+ B-cells, and CD4+ T cells, CD8+ T-cells and CD4+CD25+Foxp3+ T-regulatory cells at disease peak (C–D) and relapse (E–F) were enumerated from brain and spinal cords of individual anti-CD99 (open bars) or control IgG (closed bars) treated mice by FACS. Bolded antigens denote respective labeling on the bar graphs. Data shown in C–F are mean absolute number of CD45hi CNS infiltrating cells pooled from 3 independent experiments obtained from at least 12 mice/group. Error bars indicate standard error of the mean. **p< 0.05 by two-way ANOVA. (G–H) Peripheral blood leukocytes were from anti-CD99 or control IgG treated RR-EAE mice were collected via cardiac puncture at disease peak and relapse and manually counted (from Fig 2A). Error bars indicate SEM. **p< 0.05; ns= not significant by t-Test.

