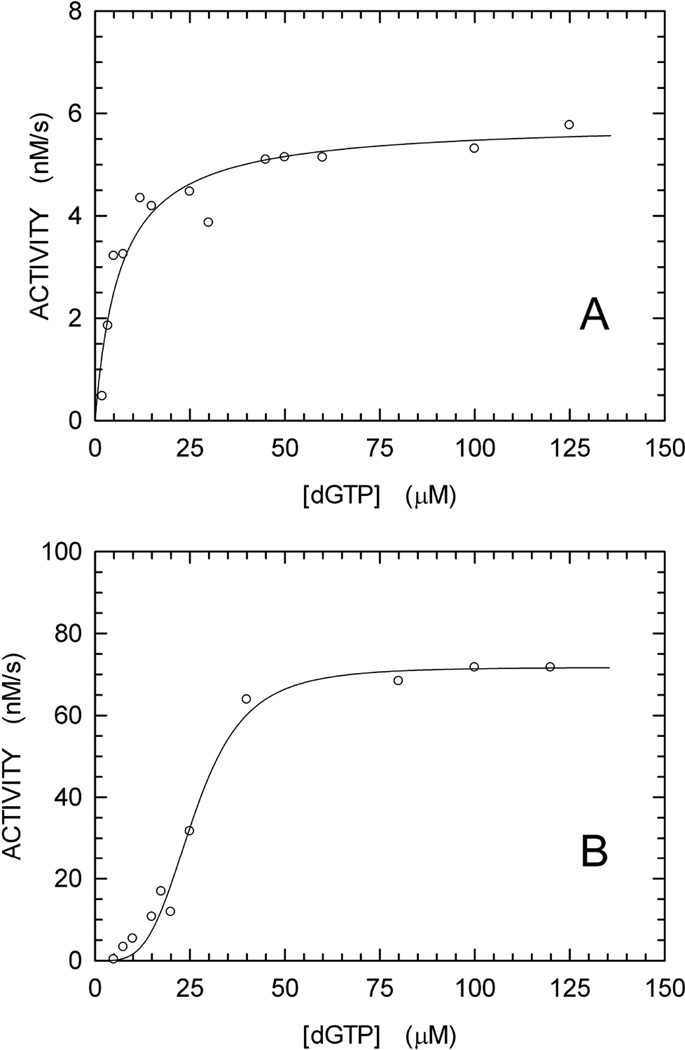
Fig. 4.
dGTPase activity of E. coli Dgt measured using two different techniques. (A) HPLC method. The Dgt (hexamer) concentration was 0.2 nM; the kcat was calculated at 29.2 ± 1.1 s−1. (B) Enzyme-coupled assay. The protein concentration used was 4 nM; the kcat was calculated at 17.9 ± 0.6 s−1. The data were fitted to the Hill equation [23]. For the curve of Fig. 4B, an N value > 1 was obtained, indicating a cooperative mechanism for dGTP hydrolysis.

