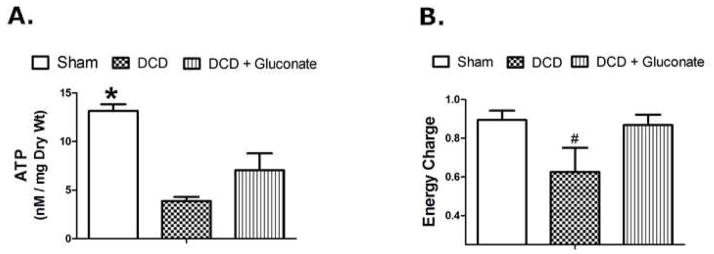
Figure 4.
ATP (Panel A) and Energy Charge (Panel B) measured in rat liver tissue 60 min after reperfusion on the isolated perfused liver device (IPL) after DCD with 24 h of cold storage in University of Wisconsin solution. The livers were: Sham, DCD, DCD + gluconate (immediately prior to cardiac death). Values are mean ± SD from 4–8 rats per group. * P<0.05 between all groups, # P<0.05 relative to the other groups.

