
Fig. 1.
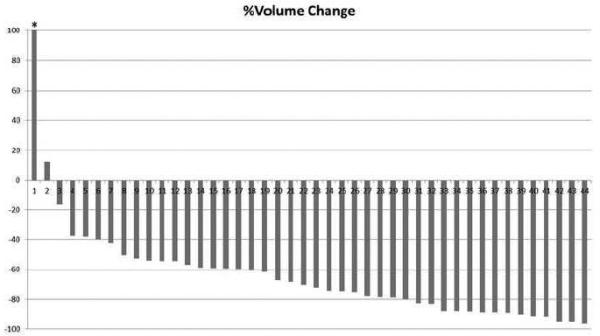
A waterfall plot of the 8-week volume decrease (%) in the 44 patients.
Each bar represents the percent change of tumor volume on the 8-week scan compared to the baseline volume in each patient. The patient indicated by an asterisk (*) had 189.7% increase in tumor volume at 8-week follow-up scan.