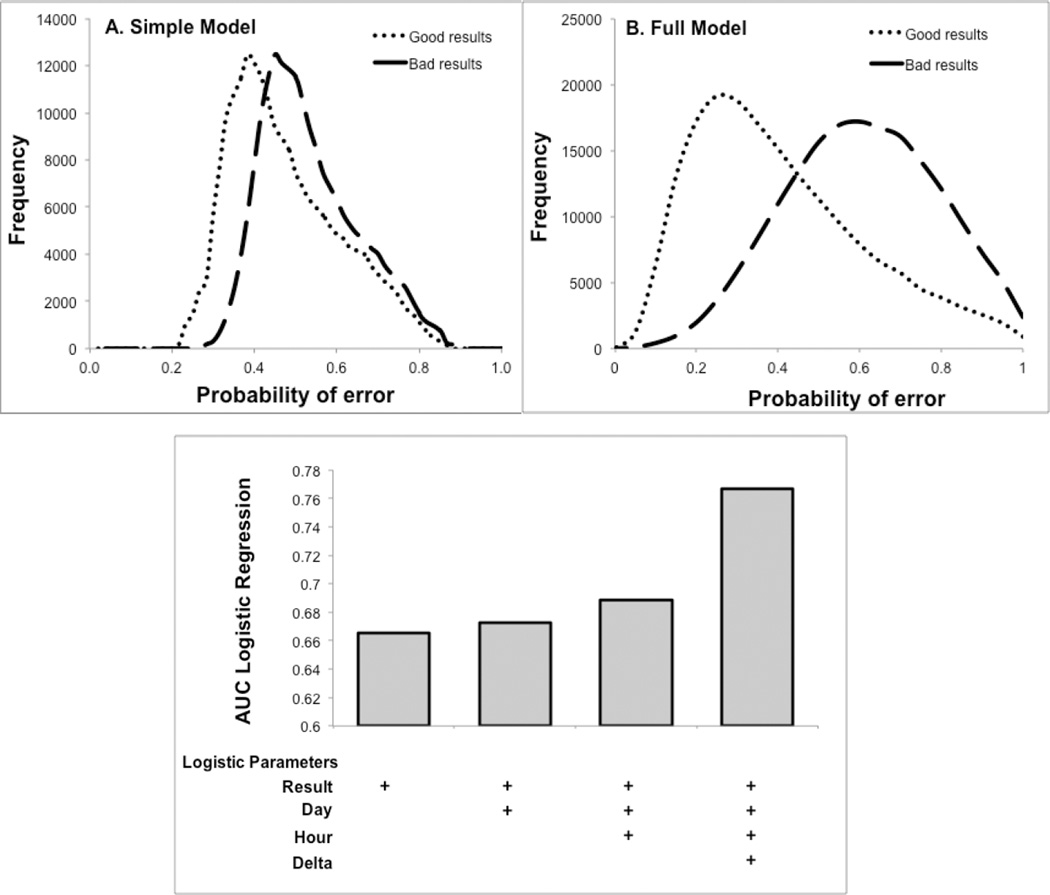
Figure 3. Difference in error prediction between full and simple CSLR models.
A 10% proportional low bias was introduced into reported “good” test results (n=53,607) to simulate “bad” test results and were analysed by the simple (Panel A) and the full (Panel B) CSLR model. The AUC of a ROC plot was calculated for distinguishing good versus bad Alb test results for the full CSLR model. This was done after stepwise inclusion of the four different input variables shown. (n=179,280) (Panel C).

