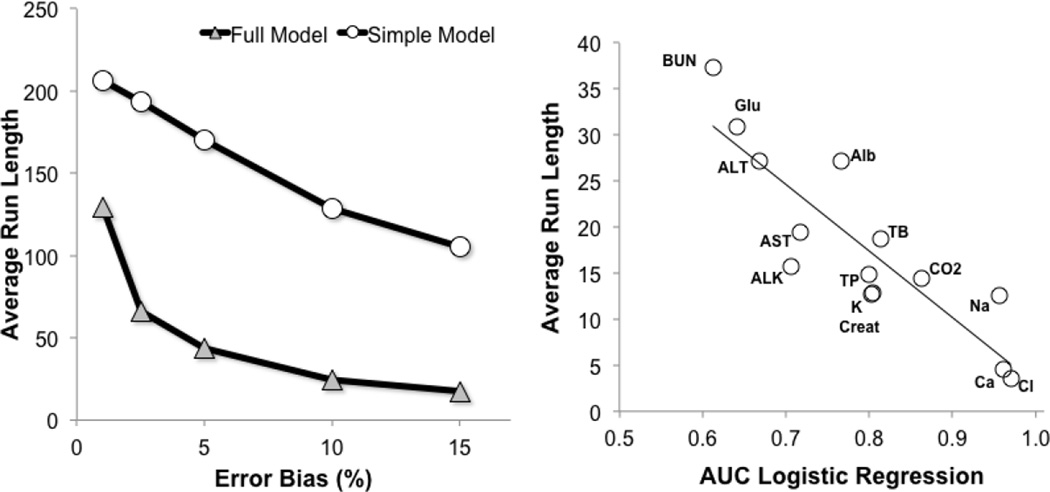
Figure 5. Relationship between magnitude of test error and ARL.
Good Alb test results were mathematically transformed to simulate various amounts of high bias as shown on the X-axis. The ARL for error detection was calculated for the simple (circle) and full (triangle) models. (Panel A, n=179,280). For each of the indicated tests, the AUC for error prediction was plotted against the ARL for error prediction for high biased tests containing errors shown in Table 1. (Panel B, n=179,280).

