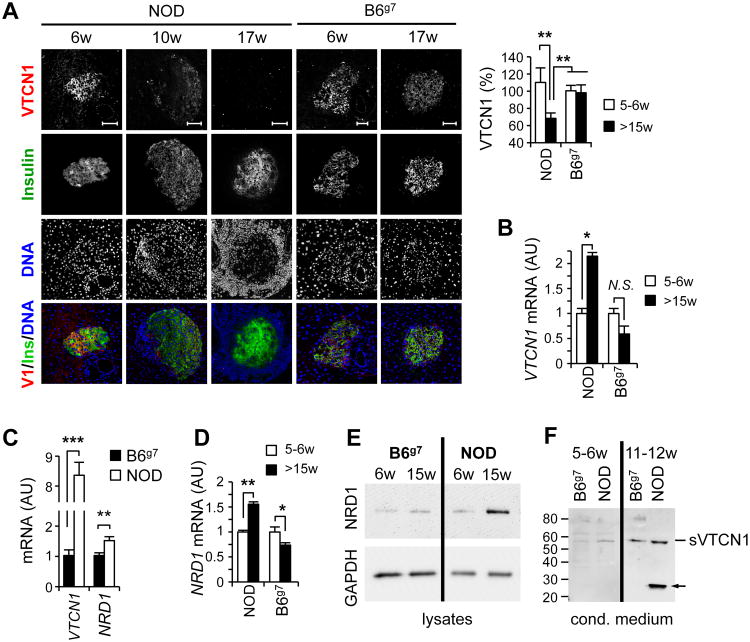
Figure 1. T1D development is accompanied by the proteolytic decrease of VTCN1 protein on islets cells.
(A) Age-related decline of VTCN1-immunoreactivity in NOD islets. Representative images (left) and quantitative analysis (right) of pancreatic cryosections from NOD and B6g7 mice of indicated ages stained for VTCN1 (red) and insulin (green). Data are expressed as a percentage of relative fluorescence units (RFU) when compared to islets from 5 week-old B6g7 mice (n=3- 5 mice/group) ±SEM. RFU were calculated for ≥20 individual islets/animal by subtracting mean control antibody fluorescence from mean test antibody fluorescence. Scale bars, 50 μm. **p<0.01 (B) RT-qPCR analysis of VTCN1 mRNA (normalized to GAPDH) isolated from pooled islets (n=4-5 mice/group) from NOD mice at the indicated age. Data are shown as mean arbitrary units (AU) ±SEM. *p<0.05. (C) Quantitative RT-qPCR analysis of VTCN1 and NRD1 mRNAs in pancreatic islets from NOD and B6g7 mice. Data are shown as the mean ±SEM (n=4-5 mice/group); **p<0.01; ***p<0.001. (D) NRD1 immunoblot of lysates of islets isolated from B6g7 or NOD mice of indicated ages. (E) VTCN1 immunoblot of medium conditioned by islets isolated from NOD or B6g7 mice. Arrow indicates a possible degradation product of sVTCN1 observed in conditioned by NOD islets medium.

