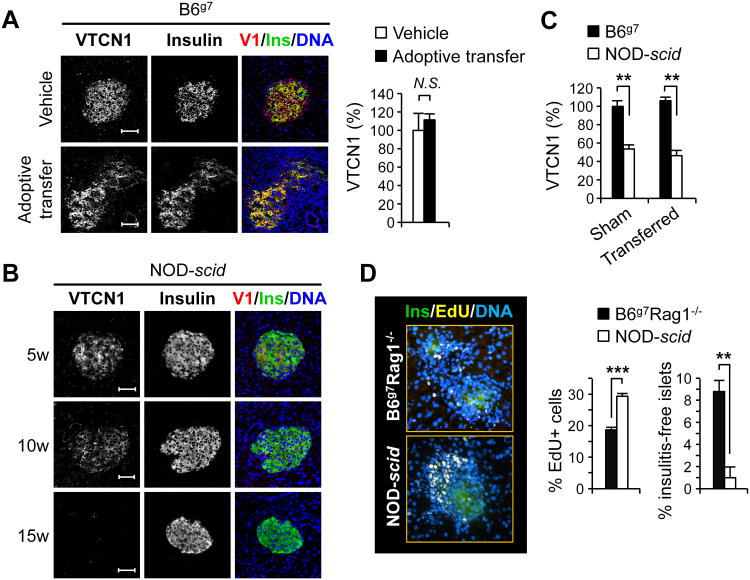
Figure 4. Autoimmunity is ameliorated by high levels of endogenous islet cells' VTCN1.
(A) Representative immunofluorescent images (left) and quantitative analysis (right) of pancreatic islets from B6g7 mice 20 days after reception of 107 splenocytes from acutely diabetic NOD mouse (Adoptive transfer) or vehicle solution (vehicle) (n=3-5 mice/group). Overlay of VTCN1 (red), insulin (green), and DNA (blue) is shown in the third column. (B) Representative images of pancreatic cryosections from NOD-scid mice of indicated ages stained for VTCN1 (red) and insulin (green). (C) Changes in the VTCN1 immunoreactivity in islets from vehicle-transferred (Sham) or splenocytes-transferred (Transferred) NOD-scid and irradiated B6g7 mice 3 weeks after adoptive transfers of 107 splenocytes from acutely diabetic NOD mice (n=3-4 mice/group). (D) Representative images (left) and quantitative analysis (right) of EdU-positive T cells within insulitic lesions of adoptively transferred, as in C, NOD-scid and B6g7-Rag1-/-mice, 3 weeks after transfer (n=3-4 mice/group). Scale bars, 50 μm; **p<0.01, ***p<0.001.

