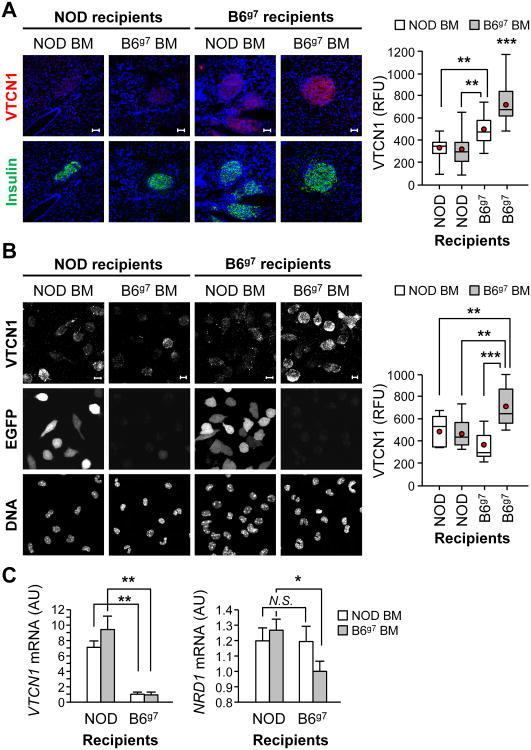
Figure 5. Cell-autonomous and systemic augmentation of NRD1, characteristic for diabetes-prone NOD mice, determines defective VTCN1 presentation in multiple cell types.
(A) Representative images (left) and quantitative analysis (right) of pancreatic cryosections from NOD and B6g7 chimeric mice collected 10 weeks after the bone marrow transfer (n=3-4 mice/group). Scale bars, 50 μm. (B) Representative images (left) and quantitative analysis (right) of peritoneal MФs isolated from NOD and B6g7 chimeric mice; Scale bars, 10 μm. A, B Red dots and the horizontal lines in each box indicate the mean and the median values, respectively. (C) RT-qPCR analysis of VTCN1 (left) and NRD1 (right) mRNAs in peritoneal MФs isolated from NOD and B6g7 chimeric mice. The generated chimeras were: NOD-EGFP→NOD (NOD-EGFP donor into NOD recipient), B6g7→NOD-EGFP (B6g7 donor into NOD-EGFP recipient), NOD-EGFP→B6g7 (NOD-EGFP donor into B6g7 recipient) and B6g7→B6g7 (B6g7 donor into B6g7 recipient); *p<0.05; **p<0.01; ***p<0.001.

