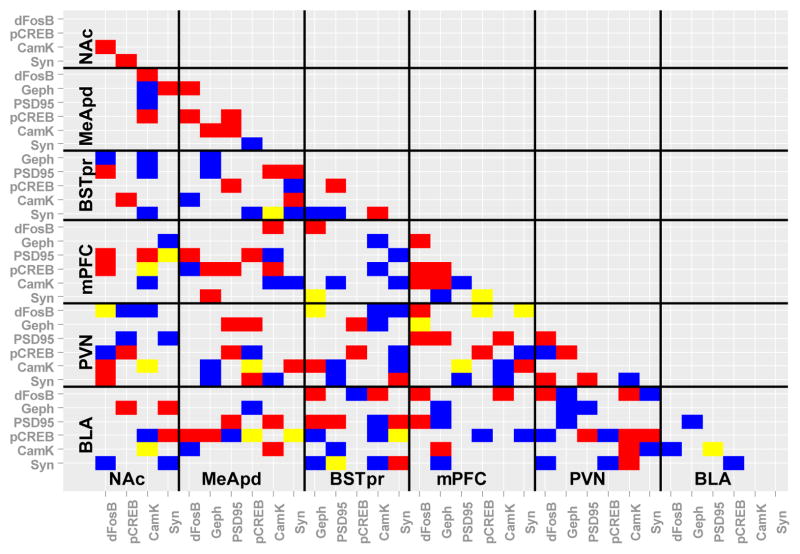
Fig. 4.
Exploratory Bayesian network analysis considered the contributions of all 6 measured proteins in all of the brain regions at once. Predicted significant relationships between proteins within and across brain regions are shown in blue for water control rats, in red for sucrose-fed rats, and in yellow for those predicted in both water control and sucrose-fed rats. dFosB= FosB/deltaFosB, Geph= gephyrin, CamK= CamKIIa, Syn= synaptophysin.

