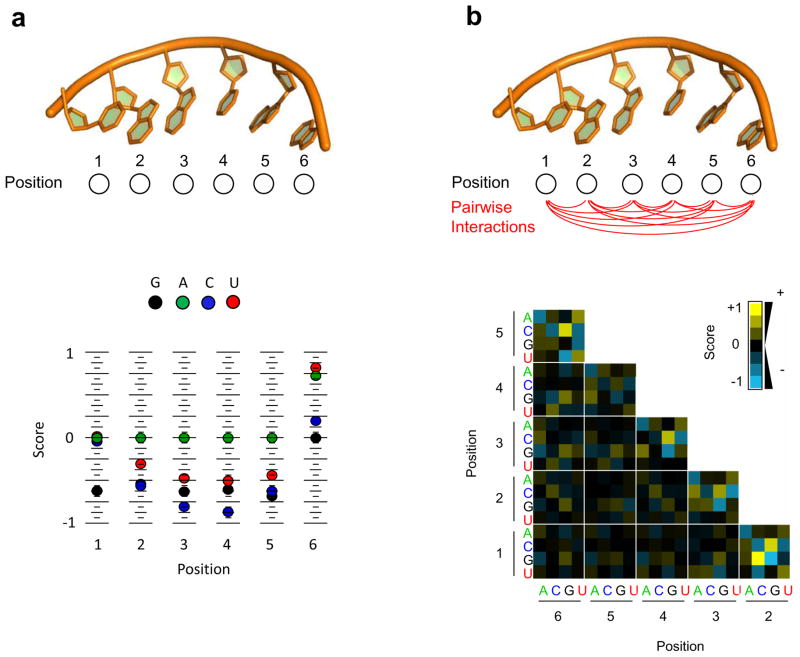
Figure 3. RBP binding models.
(a) Position Weight Matrix (PWM). The structure denotes a hypothetical RNA binding site with six nucleotides. The plot (colored dots) depicts the score (linear coefficient) for each base at each position. The score is calculated from affinity distribution such as this shown in Figure 2(b). The score for each base corresponds to the contribution of the indicated nucleotide at each position to the overall binding free energy. (b) Binding model considering interactions between two bases (Pairwise Interaction Matrix - PIM, or Dinucleotide Weight Matrix - DWM). The structure denotes a hypothetical RNA binding site with six nucleotides, lines show the possible pairwise (energetic) couplings between two nucleotides. Colored fields correspond to the score for each of the 16 pairwise nucleotide permutation at each two positions. Scores are calculated from affinity distribution such as this shown in Figure 2(b). A yellow field (denoting a high score) indicates that a given nucleotide combination promotes binding (that is, increases the overall PWM score). A blue field (low score) indicates inhibition of binding by a given nucleotide combination. A black field indicates no significant contribution either way.

