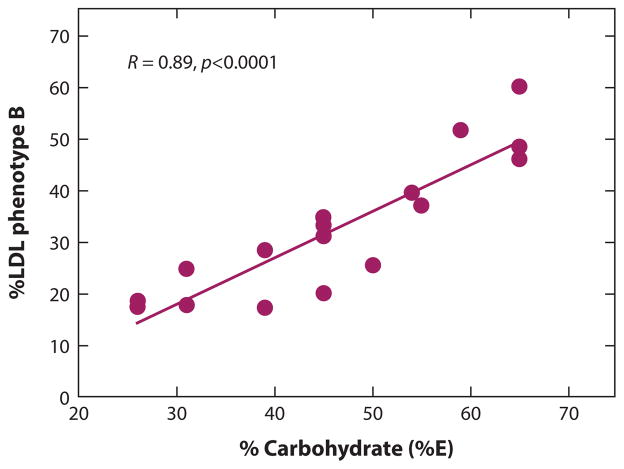
Figure 3.
Dietary carbohydrate (CHO) and low-density lipoprotein (LDL) pattern B. Variation in dietary CHO is correlated with the prevalence of pattern B (R = 0.89; p < 0.0001) in metabolic feeding studies (92, 94, 105) (n = 833 men). Each data point is the summation of the response of at least 40 individuals to a dietary regimen that controlled for CHO and lasted three to six weeks. Abbreviation: E, energy.

