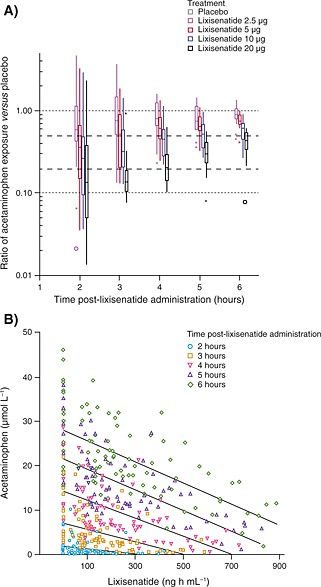
Figure 3.

(A) Ratios of cumulative hourly acetaminophen exposure* and (B) the inverse relationship between lixisenatide exposure and acetaminophen absorption, for different doses of lixisenatide over time *Placebo at each time point can be seen at a ratio of 1.0. Values that fall within 1.5–3 times the interquartile range are plotted with asterisks. Far‐outside values that are >3.0 times the interquartile range are plotted with open circles
