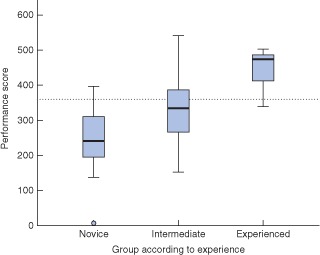
Figure 3.

Box plot of performance scores in relation to level of experience. Median values (horizontal lines), i.q.r. (boxes), and range (error bars) excluding outlier (circle) are shown. The dotted line indicates the pass–fail level. Mean(s.d.) scores for novice, intermediate and experienced surgeons were 244(88), 331(94) and 446(52) respectively
