Figure 1.

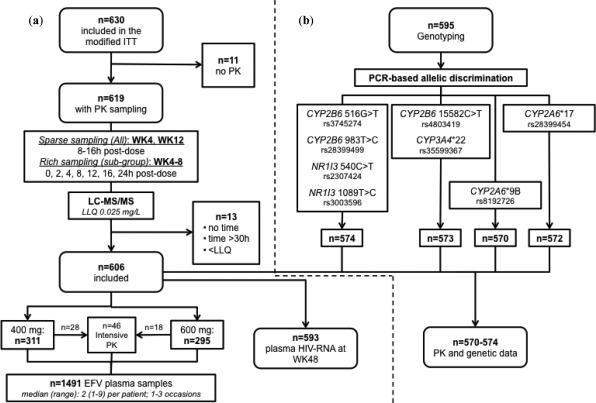
Flow diagram summarizing (a) the data included in the population PK model and (b) genetic data available for analysis. EFV: efavirenz; PK: pharmacokinetics; WK: week; LLQ: lower limit of qualification; ITT: intent to treat.

Flow diagram summarizing (a) the data included in the population PK model and (b) genetic data available for analysis. EFV: efavirenz; PK: pharmacokinetics; WK: week; LLQ: lower limit of qualification; ITT: intent to treat.