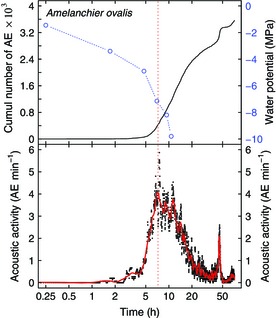
Figure 1.

Example graph illustrating the relationship of cumulative acoustic emission (AE) counts and acoustic activity. Upper panel, curve of total cumulative AE (solid curve), water potential (blue open circles) and linear interpolation (dashed blue line) vs time. Lower panel, raw (black squares) and filtered acoustic activity (solid red curve). The red dotted vertical line indicates the timing of maximum rate and Ψ at maximum AE activity (Pmaxrate). Mean SE between parallel water potential measurements was ≤ 0.2 MPa. Note that time is presented on a logarithmic scale.
