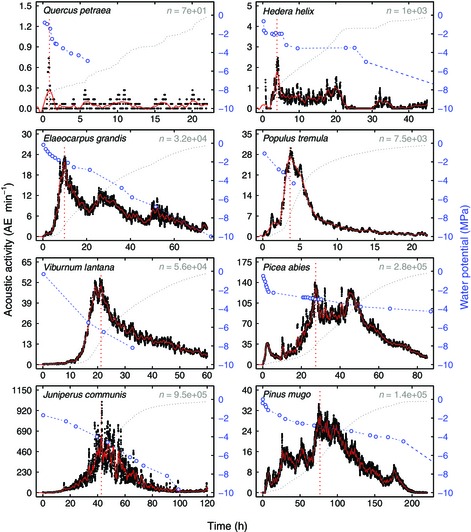
Figure 2.

Representative example graphs illustrating the progression of acoustic activity during dehydration in eight species: raw (black circles) and filtered acoustic activity (red solid curves), timing of maximum rate (red dotted vertical lines), water potential data (blue open circles) and linear interpolation (blue dashed lines). Grey dotted lines illustrate corresponding cumulative acoustic emission (AE) curves (linear scale) vs time, whereas the total number of recorded AE (n) is given in the top right corner. Mean SE between parallel water potential measurements was ≤ 0.3 MPa in all species.
