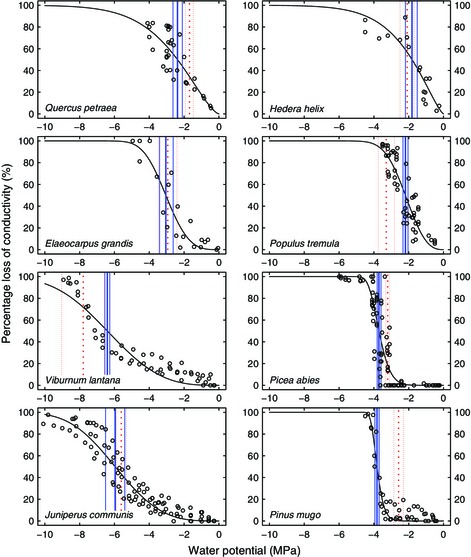
Figure 4.

Representative example graphs illustrating the relationship of 50% loss of hydraulic conductivity (P50) and the water potential (Ψ) at maximum acoustic emission (AE) activity (Pmaxrate) in hydraulic vulnerability curves in eight species according to Fig. 2: hydraulic measurements (open circles) and fitted Weibull curves (black solid lines). Blue solid lines indicate P50 (thick lines) and 95% confidence intervals (CIs, thin lines), and red dotted lines indicate Pmaxrate (thick lines) and 95% CI (thin lines).
